
Full resolution (JPEG) - On this page / på denna sida - Introduction - Pages ...
<< prev. page << föreg. sida << >> nästa sida >> next page >>
Below is the raw OCR text
from the above scanned image.
Do you see an error? Proofread the page now!
Här nedan syns maskintolkade texten från faksimilbilden ovan.
Ser du något fel? Korrekturläs sidan nu!
This page has never been proofread. / Denna sida har aldrig korrekturlästs.
burg. The mean rainfall in Sweden is 20.28 inches, that of
Gothenburg 28.18, and that of the E. coast 16.88 inches. August
is the rainiest month in Sweden , especially in the N. provinces.
In Norway the maximum rainfall is at Flore, where it sometimes
reaches 90-91 inches per annum; on the S. coast the average is
about 40 inches, and on the W. coast, to the S. and N. of Flore,
70-75 inches. August and September are the rainiest months in
the E. districts of Norway, but on the W. coast the rainy season
is somewhat later. June and July are therefore the best months
for travelling in Sweden and the E. districts of Norway, and July
and August for the W. coast. In the neighbourhood of the
Romsdal the rainy season does not usually set in before December.
Hail and thunderstorms are rare in Norway. The latter, however,
are sometimes very violent on the W. coast, where no fewer than
forty churches have been destroyed by lightning within the last
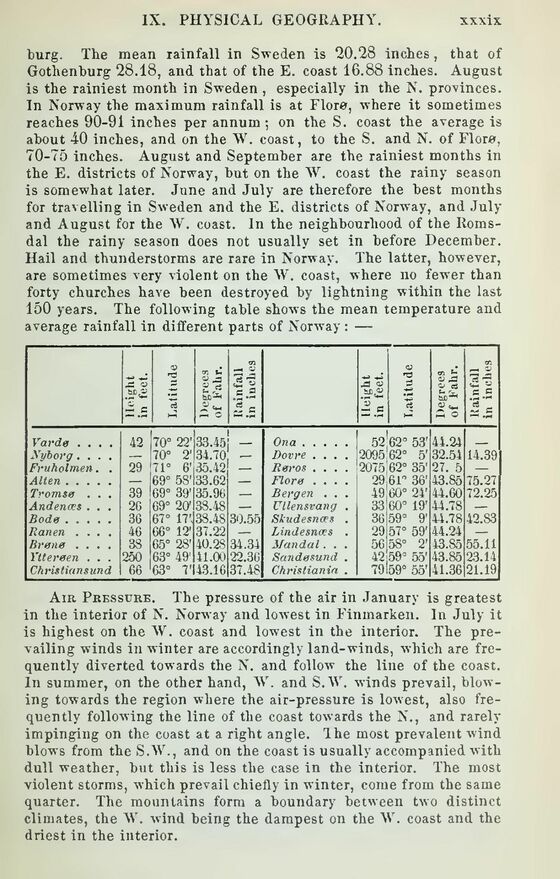
150 years. The following table shows the mean temperature and
average rainfall in different parts of Norway : —
Height in feet. Latitude Degrees of Fahr. I! ainfall in inches Height in feet. "8 Degrees of Fahr. Rainfall in inches
Vardø .... 42 70° 22’ 33.45! 1 Ona 52’ 62° 53’ 44.24 _
h’yborg.... 70° 2’ 34.70 ^ Dovre .... 2095 62° 5’ 32.54 14.39
Fruholmen. . 29 71° 6’ 35.42 ! Røros .... 2075 62° 35’ 27. 5
Alten 69° 58’ 33.62 Florø .... 29 61° 36’ 43.85 75.27
Tromsø . . . 39 69° 39’ 35.96 — Bergen . . . 49 60° 24’ 44.60 72.25
Andenms . . . 2G 69° 20’ 38.48 — Ullensvang . 33 60° 19’ 44.78 —
Bodø 36 67° 17’. 38.48 30.55 Skudesnms . 36 59° 9’ 44.78 42.83
Banen .... 46 66° 12’ 37.22 — Lindesnms . 29 57° 59’ 44.24 —
Brønø .... 38 65° 28’ 40.28 34.34 Mandal. . . 56 58° 2’ 43.85 55.11
Ytterøen . . . 250 63° 49’ 41.00 22.36 Sandøsund . 42 59’ 55’ 43.85 23.14
Christiansund 66 63° 7’ 43.16 37.4$ Christiania . 79 59° 55’ 41.36 21.19
Air Pressure. The pressure of the air in January is greatest
in the interior of N. Norway and lowest in Finmarken. In July it
is highest on the W. coast and lowest in the interior. The
prevailing winds in winter are accordingly land-winds, which are
frequently diverted towards the N. and follow the line of the coast.
In summer, on the other hand, V. and S.W. winds prevail,
blowing towards the region where the air-pressure is lowest, also
frequently following the line of the coast towards the N., and rarely
impinging on the coast at a right angle. The most prevalent wind
blows from the S.W., and on the coast is usually accompanied with
dull weather, but this is less the case in the interior. The most
violent storms, which prevail chiefly in winter, come from the same
quarter. The mountains form a boundary between two distinct
climates, the W. wind being the dampest on the 4V. coast and the
driest in the interior.
<< prev. page << föreg. sida << >> nästa sida >> next page >>