
Full resolution (JPEG) - On this page / på denna sida - 1959, H. 1 - Accuracy in Impulse Voltage Tests, by Niels Knudsen
<< prev. page << föreg. sida << >> nästa sida >> next page >>
Below is the raw OCR text
from the above scanned image.
Do you see an error? Proofread the page now!
Här nedan syns maskintolkade texten från faksimilbilden ovan.
Ser du något fel? Korrekturläs sidan nu!
This page has never been proofread. / Denna sida har aldrig korrekturlästs.
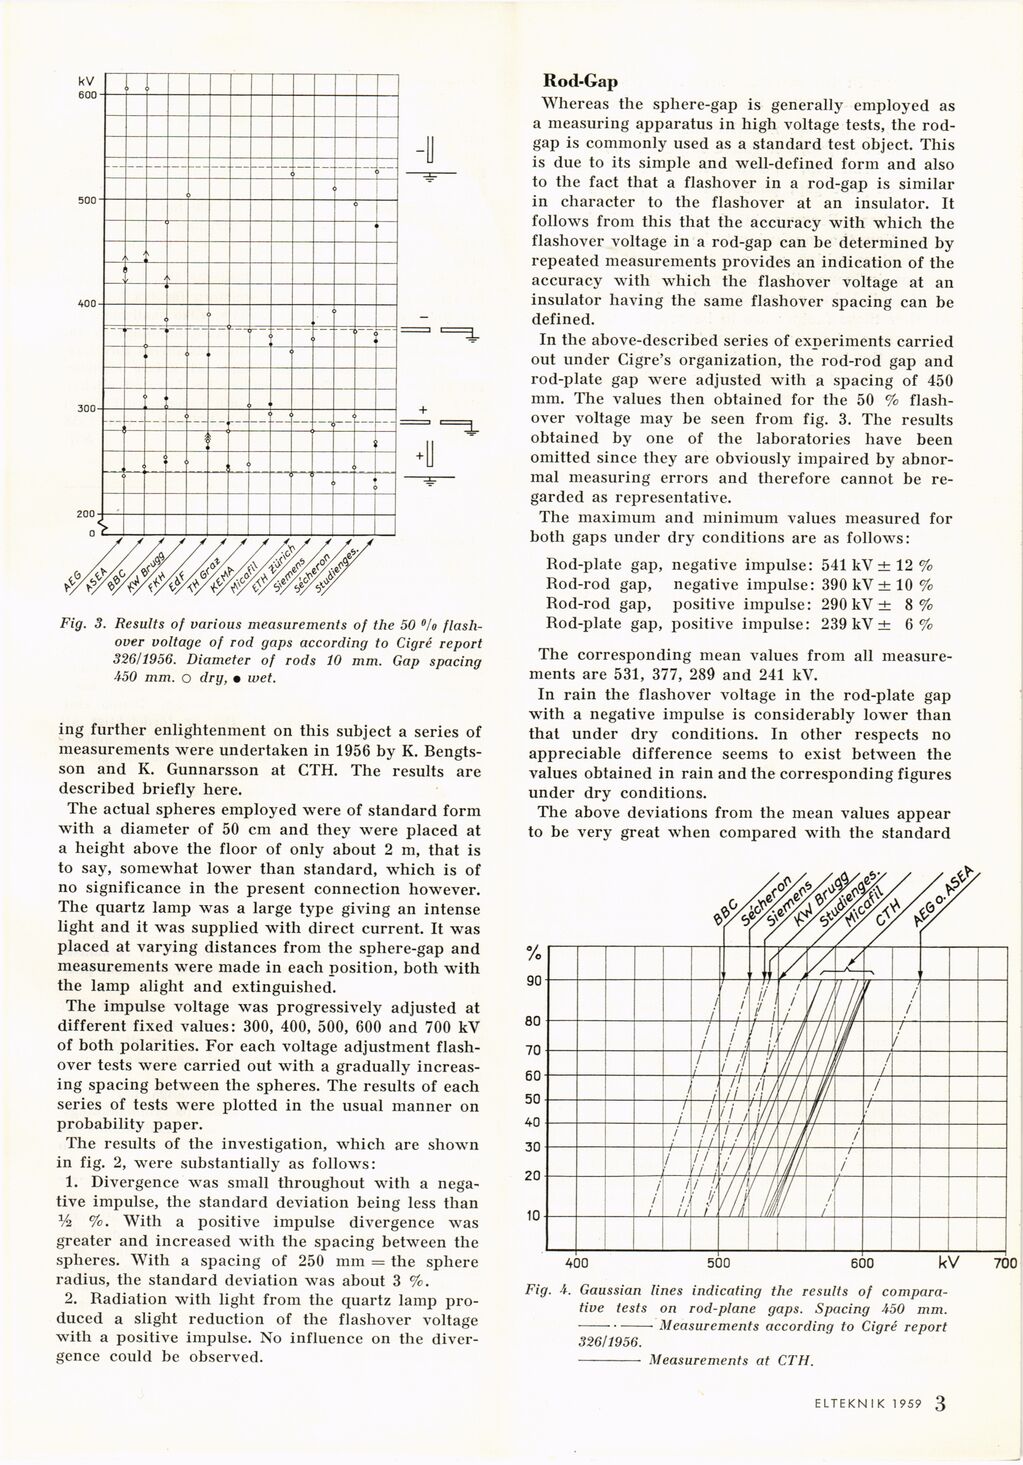
Fig. 3. Results of various measurements of the 50 °/o
flash-over voltage of rod gaps according to Cigré report
326/1956. Diameter of rods 10 mm. Gap spacing
450 mm. o dry, • wet.
ing further enlightenment on this subject a series of
measurements were undertaken in 1956 by K.
Bengtsson and K. Gunnarsson at CTH. The results are
described briefly here.
The actual spheres employed were of standard form
with a diameter of 50 cm and they were placed at
a height above the floor of only about 2 m, that is
to say, somewhat lower than standard, which is of
no significance in the present connection however.
The quartz lamp was a large type giving an intense
light and it was supplied with direct current. It was
placed at varying distances from the sphere-gap and
measurements were made in each position, both with
the lamp alight and extinguished.
The impulse voltage was progressively adjusted at
different fixed values: 300, 400, 500, 600 and 700 kV
of both polarities. For each voltage adjustment
flash-over tests were carried out with a gradually
increasing spacing between the spheres. The results of each
series of tests were plotted in the usual manner on
probability paper.
The results of the investigation, which are shown
in fig. 2, were substantially as follows:
1. Divergence was small throughout with a
negative impulse, the standard deviation being less than
V2 %. With a positive impulse divergence was
greater and increased with the spacing between the
spheres. With a spacing of 250 mm = the sphere
radius, the standard deviation was about 3 %.
2. Radiation with light from the quartz lamp
produced a slight reduction of the flashover voltage
with a positive impulse. No influence on the
divergence could be observed.
Rod-Gap
Whereas the sphere-gap is generally employed as
a measuring apparatus in high voltage tests, the
rod-gap is commonly used as a standard test object. This
is due to its simple and well-defined form and also
to the fact that a flashover in a rod-gap is similar
in character to the flashover at an insulator. It
follows from this that the accuracy with which the
flashover voltage in a rod-gap can be determined by
repeated measurements provides an indication of the
accuracy with which the flashover voltage at an
insulator having the same flashover spacing can be
defined.
In the above-described series of experiments carried
out under Cigre’s organization, the rod-rod gap and
rod-plate gap were adjusted with a spacing of 450
mm. The values then obtained for the 50 %
flash-over voltage may be seen from fig. 3. The results
obtained by one of the laboratories have been
omitted since they are obviously impaired by
abnormal measuring errors and therefore cannot be
regarded as representative.
The maximum and minimum values measured for
both gaps under dry conditions are as follows:
Rod-plate gap, negative impulse: 541kV±12%
Rod-rod gap, negative impulse: 390 kV±10%
Rod-rod gap, positive impulse: 290 kV ± 8 %
Rod-plate gap, positive impulse: 239 kV ± 6%
The corresponding mean values from all
measurements are 531, 377, 289 and 241 kV.
In rain the flashover voltage in the rod-plate gap
with a negative impulse is considerably lower than
that under dry conditions. In other respects no
appreciable difference seems to exist between the
values obtained in rain and the corresponding figures
under dry conditions.
The above deviations from the mean values appear
to be very great when compared with the standard
Fig. A. Gaussian lines indicating the results of
comparative tests on rod-plane gaps. Spacing 450 mm.
–– Measurements according to Cigré report
326/1956.
- Measurements at CTH.
ELTEKNIK 1959 1 3
<< prev. page << föreg. sida << >> nästa sida >> next page >>