
Full resolution (JPEG) - On this page / på denna sida - Comments on Rain Testing, by Sigbjörn Haraldsen
<< prev. page << föreg. sida << >> nästa sida >> next page >>
Below is the raw OCR text
from the above scanned image.
Do you see an error? Proofread the page now!
Här nedan syns maskintolkade texten från faksimilbilden ovan.
Ser du något fel? Korrekturläs sidan nu!
This page has never been proofread. / Denna sida har aldrig korrekturlästs.
have the form of drops and not jets. The size of
drops is determined by the construction of the
nozzles and the water pressure.
The water pressure normally ranges from 1.5 kg/
cm2 up to 6 kg/cm2, depending on the distance to
the test object — in other words, the test voltage
— and the extension of the test object. With a
pressure of 6 kg/cm2, there will be a considerable fog
drifting along with the larger rain drops. Most of
this will fall down before it reaches the test object,
fig. G, but some of it will sweep in under the
insulator and affect the flashover voltage. The size of the
actual rain drops may also affect the flashover
voltage, although it is difficult to establish the
mathematical relation between these two because of
problems related to the measurement of the drop sizes.
A test comparing two rain apparatuses of
approximately the same design, based on the Swiss
construction2 gave a difference of 10 % in average flashover
at power frequency voltage, fig. 7. The apparatus
giving the higher flashover values, could be observed
to give larger drops than the other one. The
precipitation, angle and resistivity were all the time the
same.
Dispersion
The flashover voltage is not only governed by the
different systematic changes occurring when
adjusting the parameters mentioned. In dry flashovers
there may be a considerable dispersion due to the
changing ionisation conditions of the gap. In rain
testing an additional variable, also due to the laws
of chance, is introduced, and that is bridging of the
insulator by the rain drops.
A few test results showing dispersions which must
be related to the laws of chance are given.
The test on supporting insulators shown in fig. 3
gives a difference of 13 % between highest and
lowest value. The supporting insulator shown in
fig. 2 has a difference of 27 % between highest and
lowest value. Testing a large experimental
circuit breaker, consisting of several vertical
supporting insulators and other supporting insulators at
an angle of about 30° to the vertical, the following
withstand levels, (a.c. 1 minute) was obtained at
different times: 700, 500 and 650 kV. The rain was
adjusted according to the specifications.
The AIEE working group on Rain Tests has
published a paper3 on wet tests carried out in
different American laboratories. The tests were made
mainly to see the effect of varying rain intensity
and rate of precipitation, but as all flashovers are
plotted, the report gives some information about the
dispersion.
On a six unit suspension insulator, 16 flashovers
varying between 320 and 235 kV were obtained,
±17 % on both sides of the average. The resistivity
and rate of precipitation were constant during the
test.
The most likely reason for the dispersion may lie
in the water paths formed on the insulators,
according to the statistical possibilities for flashover. The
S-insulator is a simple porcelain type without
intermediate metal flanges. The rain drops may bridge
a large number of variable distances. This may be
the explanation why the scatter is so high on S-
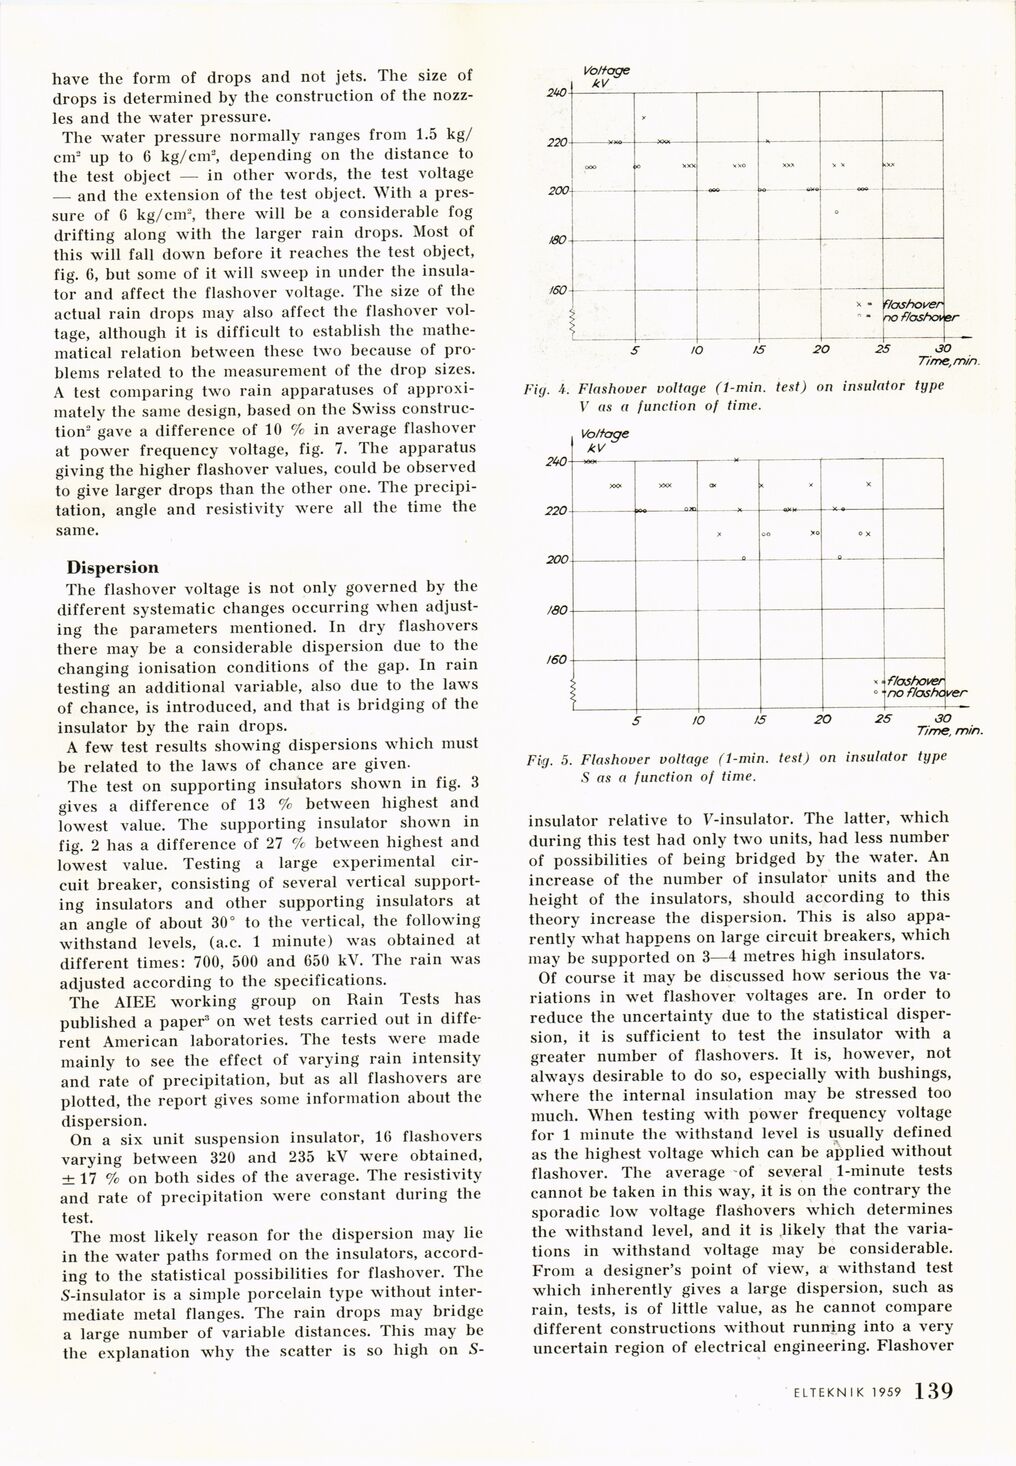
Fig. 4. Flashover voltage (1-min. test) on insulator type
V as a function of time.
Fig. 5. Flashover voltage (1-min. test) on insulator type
S as a function of time.
insulator relative to V-insulator. The latter, which
during this test had only two units, had less number
of possibilities of being bridged by the water. An
increase of the number of insulator units and the
height of the insulators, should according to this
theory increase the dispersion. This is also
apparently what happens on large circuit breakers, which
may be supported on 3—4 metres high insulators.
Of course it may be discussed how serious the
variations in wret flashover voltages are. In order to
reduce the uncertainty due to the statistical
dispersion, it is sufficient to test the insulator with a
greater number of flashovers. It is, however, not
always desirable to do so, especially with bushings,
where the internal insulation may be stressed too
much. When testing with power frequency voltage
for 1 minute the withstand level is usually defined
as the highest voltage which can be applied without
flashover. The average -of several 1-minute tests
cannot be taken in this way, it is on the contrary the
sporadic low voltage flashovers which determines
the withstand level, and it is likely that the
variations in withstand voltage may be considerable.
From a designer’s point of view, a withstand test
which inherently gives a large dispersion, such as
rain, tests, is of little value, as he cannot compare
different constructions without running into a very
uncertain region of electrical engineering. Flashover
ELTEKN I K 1959 1 33
<< prev. page << föreg. sida << >> nästa sida >> next page >>