
Full resolution (JPEG) - On this page / på denna sida - First part - I. Physical Geography - 2. Climate. By N. Ekholm, Ph. D., Central Meteorological Office, Stockholm
<< prev. page << föreg. sida << >> nästa sida >> next page >>
Below is the raw OCR text
from the above scanned image.
Do you see an error? Proofread the page now!
Här nedan syns maskintolkade texten från faksimilbilden ovan.
Ser du något fel? Korrekturläs sidan nu!
This page has never been proofread. / Denna sida har aldrig korrekturlästs.
24
I. physical geography of sweden.
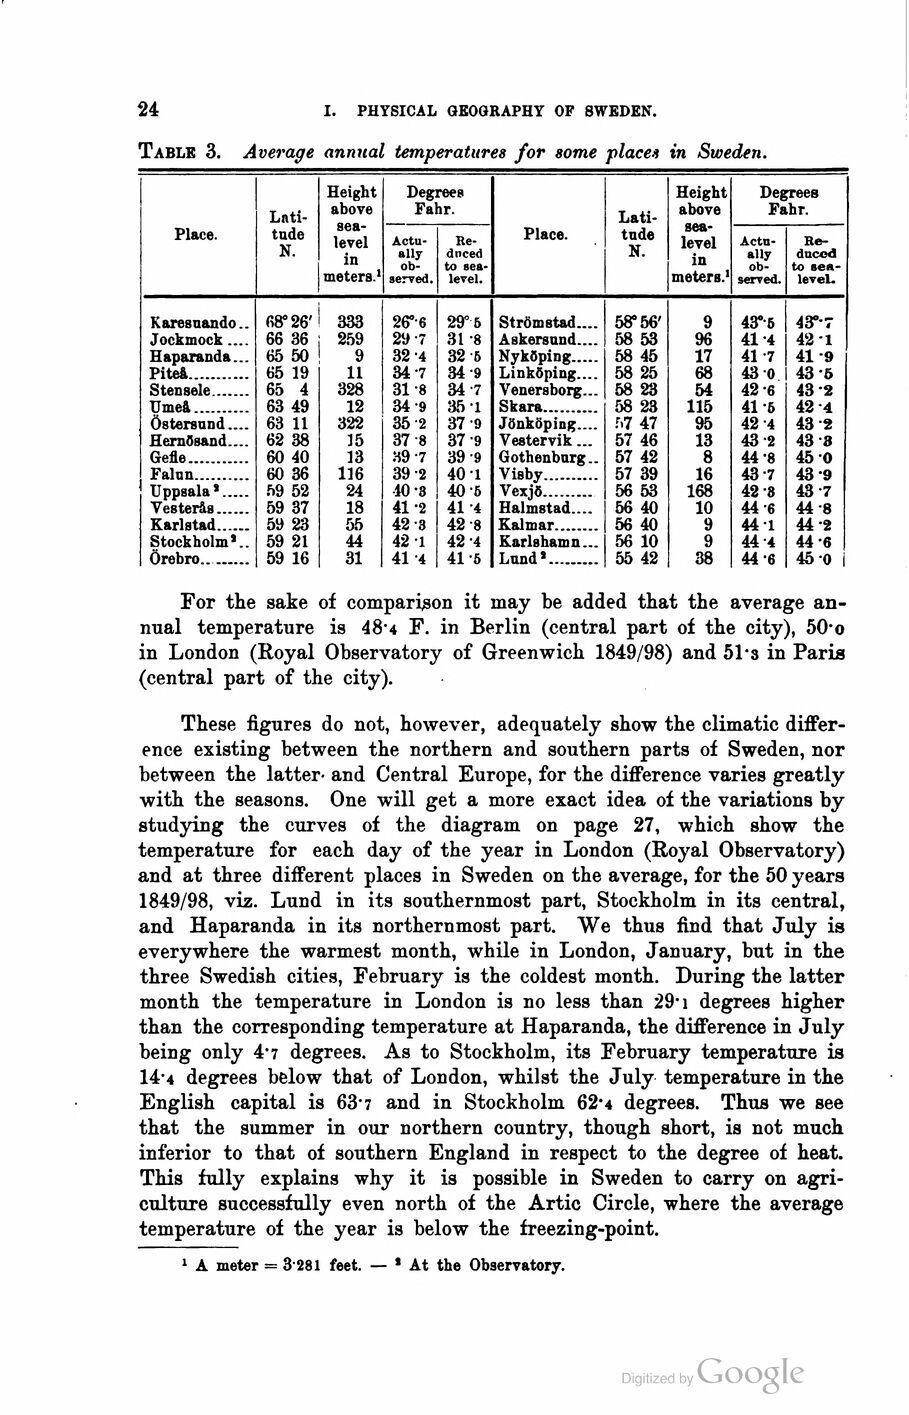
Table 3. Average annual temperatures for some places in Sweden.
Place. [-Latitude-] {+Lati- tude+} N. Height above
sea-level in meters.1 Degrees Fahr.
[-Actually observed. Reduced-]
{+Actu- ally ob- served. Re- duced+} to
sea-level.
Karesuando.. 68° 26’ 333 26°’6 29° 5
Jockmock .... 66 36 259 29 7 31 "8
Haparanda... 65 50 9 32 4 32 ß
Piteå........... 65 19 11 34-7 34-9
Stensele....... 65 4 328 31 -8 34-7
Umeå........... 63 49 12 34-9 35-1
Östersund.... 63 11 322 35-2 37-9
Hernösand.... 62 38 35 37-8 37-9
Gefle........... 60 40 13 39-7 39-9
Falun.......... 60 36 116 39-2 40 1
Uppsala 8..... 59 52 24 10-3 40 5
Vesterås...... 59 37 18 41 -2 41 4
Karlstad...... 59 23 55 42-3 42-8
Stockholm*.. 59 21 44 42-1 42 -4
Örebro........ 59 16 31 41 ’4 41-5
Strömstad.... 58° 56’ 9 43°’5 4ST-7
Askersund.... 58 53 % 41*4 42 1
Nyköping..........58 45 17 41 -7 41 -9
Linköping.... 58 25 68 43 0 43 ’6
Venersborg... 58 23 54 42 6 43 "2
Skara....................58 23 115 41 6 42 4
Jönköping.... f.7 47 95 42 4 43 2
Vestervik... 57 46 13 43 2 43 3
Gothenburg.. 57 42 8 44"8 45 O
Visby....................57 39 16 43 7 43 9
Vexjö..................56 53 168 42 8 43 7
Halmstad.... 56 40 10 44 6 44 8
Kalmar................56 40 9 44 1 44 "2
Karlshamn... 56 10 9 44 4 44 6
Lund’..................55 42 38 44’6 45 0
For the sake of comparison it may be added that the average
annual temperature is 48-4 F. in Berlin (central part of the city), 50-o
in London (Royal Observatory of Greenwich 1849/98) and 51-3 in Paris
(central part of the city).
These figures do not, however, adequately show the climatic
difference existing between the northern and southern parts of Sweden, nor
between the latter- and Central Europe, for the difference varies greatly
with the seasons. One will get a more exact idea of the variations by
studying the curves of the diagram on page 27, which show the
temperature for each day of the year in London (Royal Observatory)
and at three different places in Sweden on the average, for the 50 years
1849/98, viz. Lund in its southernmost part, Stockholm in its central,
and Haparanda in its northernmost part. We thus find that July is
everywhere the warmest month, while in London, January, but in the
three Swedish cities, February is the coldest month. During the latter
month the temperature in London is no less than 29" i degrees higher
than the corresponding temperature at Haparanda, the difference in July
being only 4-7 degrees. As to Stockholm, its February temperature is
14-4 degrees below that of London, whilst the July temperature in the
English capital is 63-7 and in Stockholm 62-4 degrees. Thus we see
that the summer in our northern country, though short, is not much
inferior to that of southern England in respect to the degree of heat.
This fully explains why it is possible in Sweden to carry on
agriculture successfully even north of the Artie Circle, where the average
temperature of the year is below the freezing-point.
1 A meter = 3 281 feet. — * At the Observatory.
<< prev. page << föreg. sida << >> nästa sida >> next page >>