
Full resolution (JPEG) - On this page / på denna sida - First part - II. The Swedish People - 2. Demography of Sweden - The movement of population in different »läns» - Civil condition and marriages
<< prev. page << föreg. sida << >> nästa sida >> next page >>
Below is the raw OCR text
from the above scanned image.
Do you see an error? Proofread the page now!
Här nedan syns maskintolkade texten från faksimilbilden ovan.
Ser du något fel? Korrekturläs sidan nu!
This page has never been proofread. / Denna sida har aldrig korrekturlästs.
DEMOGRAPHY OF SWEDEN.
115-
The movement of population in different >l&ns>.
The division of the population according to place of living, sex,
age, occupation, etc. constitutes what is called at times the Stand of the
population. The changes among the people by marriages, births, deaths,
immigration, and emigration constitute the second division of demography
and is called the Movement of the population. Each one of the chapters
belonging to this division is in the following pages treated by itself;
but, in order to save space, the principal data for the different läns
are collected and given in Table 15, p. 114. This table relates to the
decade 1881/90, the latest period for which more special calculations
can yet be made. The contents of the table can be partly seen on
the maps following and the subject is again touched upon at the
presentation of the figures for the entire country; some of its principal
features are already pointed out on p. 92. We must remember that
the decade which has just ended (1891/1900) is marked by a
considerably smaller emigration than the period 1881/90, and thus also by
a greater increase of population. From 1880 to 1890 the population
was lessened in nine läns, as shown by Table 15, and from 1890 to
1900, only in four (Kronoberg, Kalmar, Kristianstad, and Skaraborg);
the figures for the yearly increase during the last mentioned decade are
given on p. 98.
Civil condition and marriages.
The fairest picture of Sweden’s demography is that presented by the
chapter on mortality; the most unsatisfactory, that presented by the
chapter dealing with the statistics of marriages, and with those of
emigration.
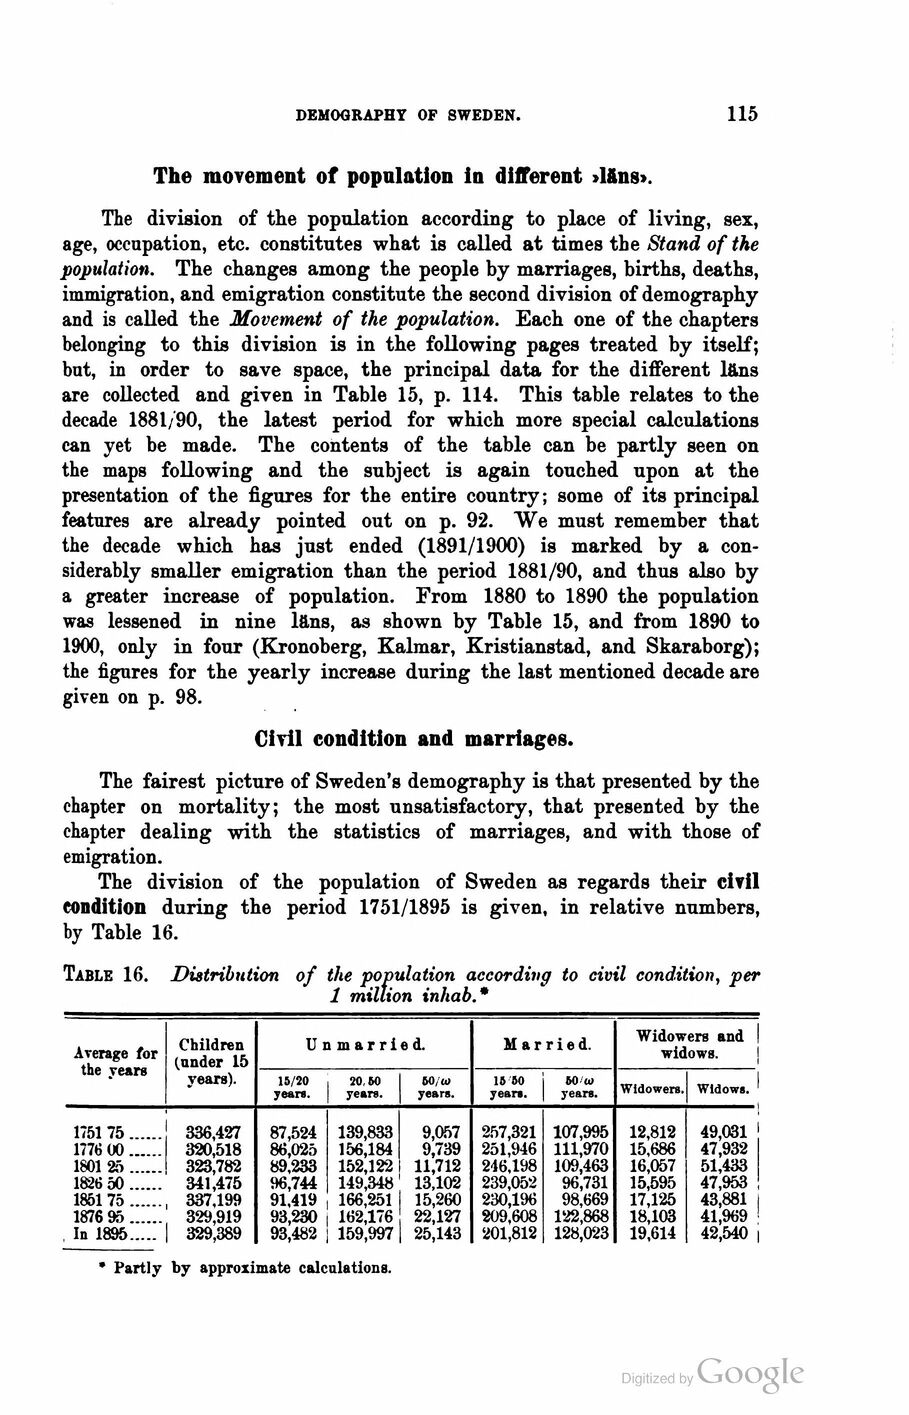
The division of the population of Sweden as regards their civil
condition during the period 1751/1895 is given, in relative numbers,
by Table 16.
Table 16. Distribution of the population according to civil condition, per
1 million inhab. *
Average for the years Children (under 15 veara). Unmarried. Married. Widowers and 1 widows. J
15/20 year». 20,60 years. bO/w years. 16 60 years. 60 w years. Widowers. Widows. ’
* Partly by approximate calculations.
175175 ............336,427 87,524 139,833 9,057 257,321 107,995 12,812 49,031
1776 00 ............320,518 86,025 156,184 9,739 251,946 111,970 15,686 47,932
1801 25 ............323,782 89,233 152,122 11,712 246,198 109,463 16,057 51,433
1826 50 ............341,475 96,744 149,348 13,102 239,052 96,731 15,595 47,953
185175 ......, 337,199 91,419 166,251 I 15,260 230,196 98,669 17,125 43,881
1876 95 ............329,919 93,230 j 162,176 22,127 209,608 122,868 18,103 41,969
In 1895 ..........329,389 93,482 159,997 25,143 201,812 128,023 19,614 42,540
<< prev. page << föreg. sida << >> nästa sida >> next page >>