
Full resolution (JPEG) - On this page / på denna sida - Second part - X. Manufacturing Industries. By Å. G. Ekstrand, Ph. D., Chief Engineer, Control Office of the Department of Finance
<< prev. page << föreg. sida << >> nästa sida >> next page >>
Below is the raw OCR text
from the above scanned image.
Do you see an error? Proofread the page now!
Här nedan syns maskintolkade texten från faksimilbilden ovan.
Ser du något fel? Korrekturläs sidan nu!
This page has never been proofread. / Denna sida har aldrig korrekturlästs.
introduction.
767
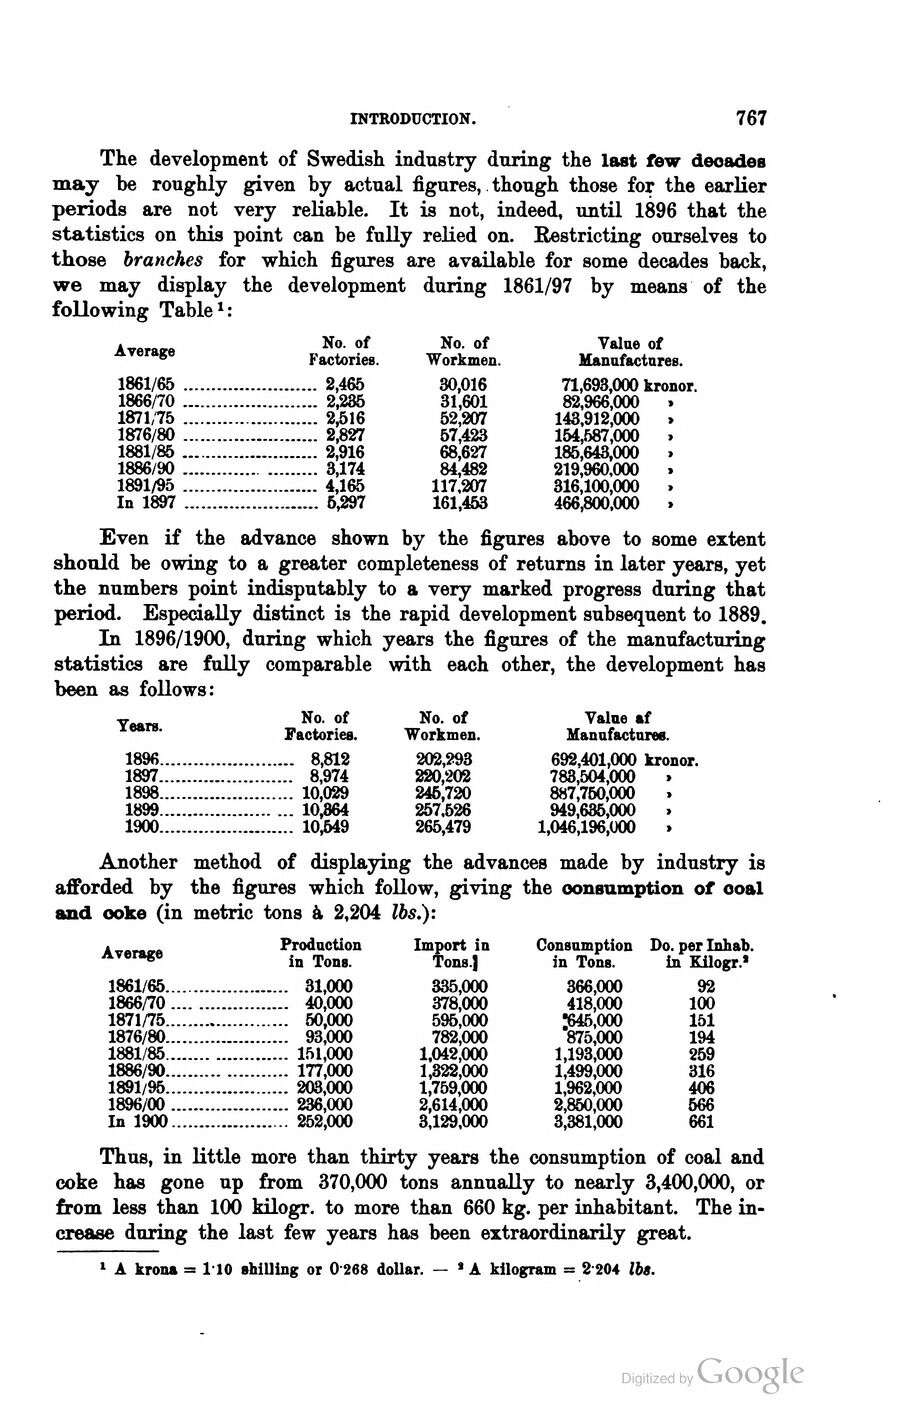
The development of Swedish industry during the last few decades
may be roughly given by actual figures, though those for the earlier
periods are not very reliable. It is not, indeed, until 1896 that the
statistics on this point can be fully relied on. Restricting ourselves to
those branches for which figures are available for some decades back,
we may display the development during 1861/97 by means of the
following Table1:
Average
No. of
Factories.
No. of
Workmen.
Value of
Manufactures.
1861/65 ........................ 2,465 30,016 71,693,000 kronor.
1866/70 ........................ 2,235 31,601 82,966,000 .
1871/75 ........................ 2,516 52,207 143,912,000 »
1876/80 ........................ 2,827 57,423 154,587,000 »
1881/85 ........................ 2,916 68,627 185,643,000 .
1886/90 ....................... 3,174 84,482 219,960,000 >
1891/95 ........................ 4,165 117,207 316,100,000 .
In 1897 ........................ 6,297 161,453 466,800,000 »
Even if the advance shown by the figures above to some extent
should be owing to a greater completeness of returns in later years, yet
the numbers point indisputably to a very marked progress during that
period. Especially distinct is the rapid development subsequent to 1889.
In 1896/1900, during which years the figures of the manufacturing
statistics are fully comparable with each other, the development has
been as follows:
Years.
No. of
Factories.
No. of
Workmen.
Value af
Manufactures.
189 6........................ 8,812 202,293 692,401,000 kronor.
189 7........................ 8,974 220,202 783,504,000 »
189 8........................ 10,029 246,720 887,760,000 >
189 9....................... 10,364 257.626 949,635,000 >
190 0........................ 10,549 265,479 1,046,196,000 »
Another method of displaying the advances made by industry is
afforded by the figures which follow, giving the consumption of coal
and ooke (in metric tons à 2,204 lbs.):
Average
Production
in Tons.
Import in
Tons.]
Consumption Do. per Inhab.
in Tons. In Kilogr.*
1861/65...................... 31,000 335,000 366,000 92
1866/70 .................... 40,000 378,000 418,000 100
1871/75...................... 50,000 596,000 "645,000 151
1876/80...................... 93,000 782,000 875,000 194
1881/85..................... 151,000 1,042,000 1,193,000 259
1886/90..................... 177,000 1,322,000 1,499,000 316
1891/95...................... 203,000 1,759,000 1,962,000 406
1896/00 ..................... 236,000 2,614,000 2,850,000 566
In 1900.................. .252,000 3,129,000 3,381,000 661
Thus, in little more than thirty years the consumption of coal and
coke has gone up from 370,000 tons annually to nearly 3,400,000, or
from less than 100 kilogr. to more than 660 kg. per inhabitant. The
increase during the last few years has been extraordinarily great.
1 A kron» = 1 10 »hilling or 0 268 dollar. — 1 A kilogram = 2 204 lbs.
<< prev. page << föreg. sida << >> nästa sida >> next page >>