
Full resolution (JPEG) - On this page / på denna sida - VI. Mining and Metallurgical Industry. General Survey. By C. Sahlin - 3. Production of other Metals. By J. G. Petrén
<< prev. page << föreg. sida << >> nästa sida >> next page >>
Below is the raw OCR text
from the above scanned image.
Do you see an error? Proofread the page now!
Här nedan syns maskintolkade texten från faksimilbilden ovan.
Ser du något fel? Korrekturläs sidan nu!
This page has never been proofread. / Denna sida har aldrig korrekturlästs.
production of other metals.
307
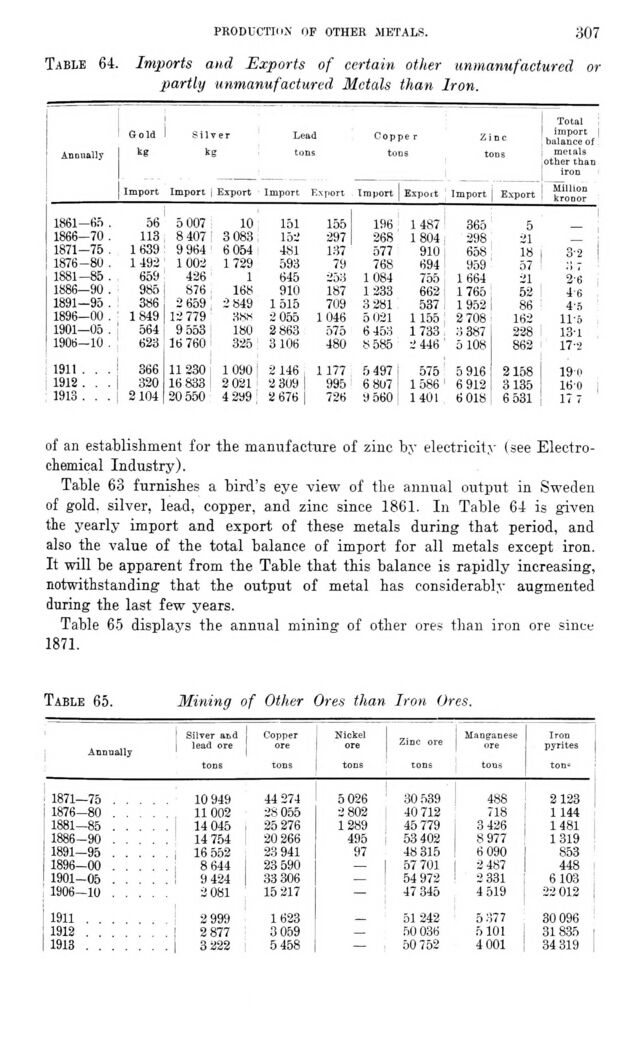
Table 64. Imports and Exports of certain other unmanufactured or
partly unmanufactured Metals than Iron.
Annually Gold kg Silver kg Lead tons Coppe r tons Zinc tons Total import balance of metals other than iron
Import Import j Export Import Export Import I Export Import j Export Million kronor
1861- -65 . 56 5 007 10 151 155 196 1487 365 5 _
1866- -70 . 113 8 407 3 083 152 297 268 1804 298 21 _
1871- -75 . 1639 9 964 6 054 481 137 577 910 658 18 i 3-2
1876 -80 . 1192 1 002 1729 593 79 768 694 959 57 o 7
1881- -85 . 659 426 1 645 253 1 084 755 1 664 21 2-6
1886- -90 . 985 876 168 910 187 1 233 662 1765 52 4-6
1891- -95 . 386 2 659 2«49 1515 709 3 281 537 1952 86 4’5
1896- -00 . 1849 12 779 3KS 2 055 1 046 5 021 1 155 2 708 162 11-5
1901- -05 . 564 9 553 180 2 863 575 6 453 1 733 3 387 228 13-1
1906- -10 . 623 16 760 325 3 106 480 8 585 2 446 5 108 862 17-2
1911 366 11 230 1090 2146 1177 5 497 575 5 916 2158 19 o
1912 320 16 833 2 021 2 309 ! 995 6 807 1586 6 912 3135 160
1913 2104 20 550 4 299 a 676 | 726 9 560 1 401 6 018 6 531 ; 17 7
of an establishment for the manufacture of zinc by electricity (see
Electrochemical Industry).
Table 63 furnishes a bird’s eye view of the annual output in Sweden
of gold, silver, lead, copper, and zinc since 1861. In Table 64 is given
the yearly import and export of these metals during that period, and
also the value of the total balance of import for all metals except iron.
It will be apparent from the Table that this balance is rapidly increasing,
notwithstanding that the output of metal has considerably augmented
during the last few years.
Table 65 displays the annual mining of other ores than iron ore since
1871.
Table 65.
Mining of Other Ores than Iron Ores.
Annually
Silver arid
lead ore
Copper
ore
Nickel
ore
Zinc ore
tons
Manganese
ore
Iron
pyrites
1871—75 . . . . . 10 949 44 274 5 026 30 539 488 2123
1876-80 . . . . . 11 002 2H 055 2 802 40 712 718 1144
1881—85 . . . . . 14 045 25 276 1289 45 779 3 426 1481
1886-90 . . . . . 14 754 20 266 495 53 402 8 977 1319
1891-95 . . . . . 16 552 23 941 97 48 315 6 090 853
1896-00 . . . 8 644 23 590 — 57 701 2 487 448
1901-05 . . . . . 1 9 424 33 306 -— 54 972 2 331 6103
1906-10 . . . 2 081 15 217 — 47 345 4 519 22 012 ;
1911..... 2 999 1623 _ 51 242 5 377 30 096
1912..... . . 2 877 3 059 _ 50 036 5101 31835 |
1913..... 3 222 5 458 — 50 752 4 001 34 319
<< prev. page << föreg. sida << >> nästa sida >> next page >>