
Full resolution (JPEG) - On this page / på denna sida - VIII. Commerce. [By A. Berencreutz] - Commercial Exchange with different Countries. By K. G. Wetterlund - Customs. By K. G. Wetterlund
<< prev. page << föreg. sida << >> nästa sida >> next page >>
Below is the raw OCR text
from the above scanned image.
Do you see an error? Proofread the page now!
Här nedan syns maskintolkade texten från faksimilbilden ovan.
Ser du något fel? Korrekturläs sidan nu!
This page has never been proofread. / Denna sida har aldrig korrekturlästs.
528
viii. commerce.
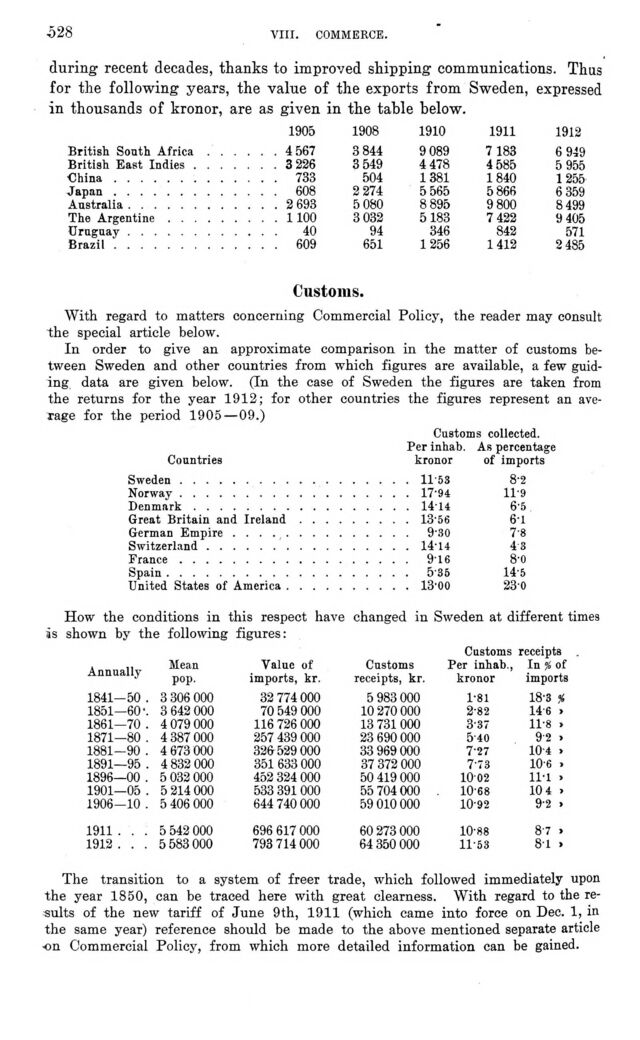
during recent decades, thanks to improved skipping communications. Thus
for the following years, the value of the exports from Sweden, expressed
in thousands of kronor, are as given in the table below.
1905 1908 1910 1911 1912
British South Africa . . . . . .4 567 3 844 9 089 7 183 6 949
British East Indies . . . .... 3226 3 549 4 478 4 585 5 955
■China......... .... 733 504 1381 1840 1255
Japan ......... .... 608 2 274 5 565 5 866 6 359
Australia........ .... 2693 5 080 8 895 9 800 8 499
The Argentine..... .... 1100 3 032 5183 7 422 9 405
Uruguay ........ .... 40 94 346 842 571
Brazil......... .... 609 651 1256 1412 2 485
Customs.
With regard to matters concerning Commercial Policy, the reader may consult
the special article below.
In order to give an approximate comparison in the matter of customs
between Sweden and other countries from which figures are available, a few
guiding data are given below. (In the case of Sweden the figures are taken from
the returns for the year 1912; for other countries the figures represent an
average for the period 1905 — 09.)
Customs collected.
Per inhab. As percentage
Countries kronor of imports
Sweden............. .....11 53 8-2
Norway............. .....17’94 11-9
Denmark............ .....1414 6-5
Great Britain and Ireland .... .....13-56 6-1
German Empire......... ..... 9-30 7-8
Switzerland........... .....14-11 43
France ............. ..... 916 8-0
Spain.............. ..... 535 14-5
United States of America..... .....13-00 230
How the conditions in this respect have changed in Sweden at different times
is shown by the following figures:
Customs receipts
A Mean Value of Customs Per inhab., In % of
Annually pop. imports, kr. receipts, kr. kronor imports
1841- -50 . 3 306 000 32 774 000 5 983 000 1-81 18-3 %
1851- -60 •. 3 642 000 70 549 000 10 270 000 2-82 14-6 »
1861- -70 . 4 079 000 116 726 000 13 731 000 337 11-8 >
1871- -80 . 4 387 000 257 439 000 23 690 000 5’40 9-2 >
1881- -90 . 4 673 000 326529 000 33 969 000 7-27 10-4 J
1891- -95 . 4 832 000 351 633 000 37 372 000 7-73 10-6 »
1896- -00 . 5 032 000 452 324 000 50 419 000 1002 11-1 >
1901- -05 . 5 214 000 533 391 000 55 704 000 10’68 10 4 >
1906- -10 . 5 406 000 644 740 000 59 010 000 10-92 9-2 »
1911 5 542 000 696 617 000 60 273 000 10-88 8’7 >
1912 5 583 000 793 714 000 64 350 000 11-53 8-1 >
The transition to a system of freer trade, which followed immediately upon
the year 1850, can be traced here with great clearness. With regard to the
results of the new tariff of June 9th, 1911 (which came into force on Dec. 1, in
the same year) reference should be made to the above mentioned separate article
on Commercial Policy, from which more detailed information can be gained.
<< prev. page << föreg. sida << >> nästa sida >> next page >>