
Full resolution (JPEG) - On this page / på denna sida - Sidor ...
<< prev. page << föreg. sida << >> nästa sida >> next page >>
Below is the raw OCR text
from the above scanned image.
Do you see an error? Proofread the page now!
Här nedan syns maskintolkade texten från faksimilbilden ovan.
Ser du något fel? Korrekturläs sidan nu!
This page has never been proofread. / Denna sida har aldrig korrekturlästs.
Kemi
8 febr. 1941
17
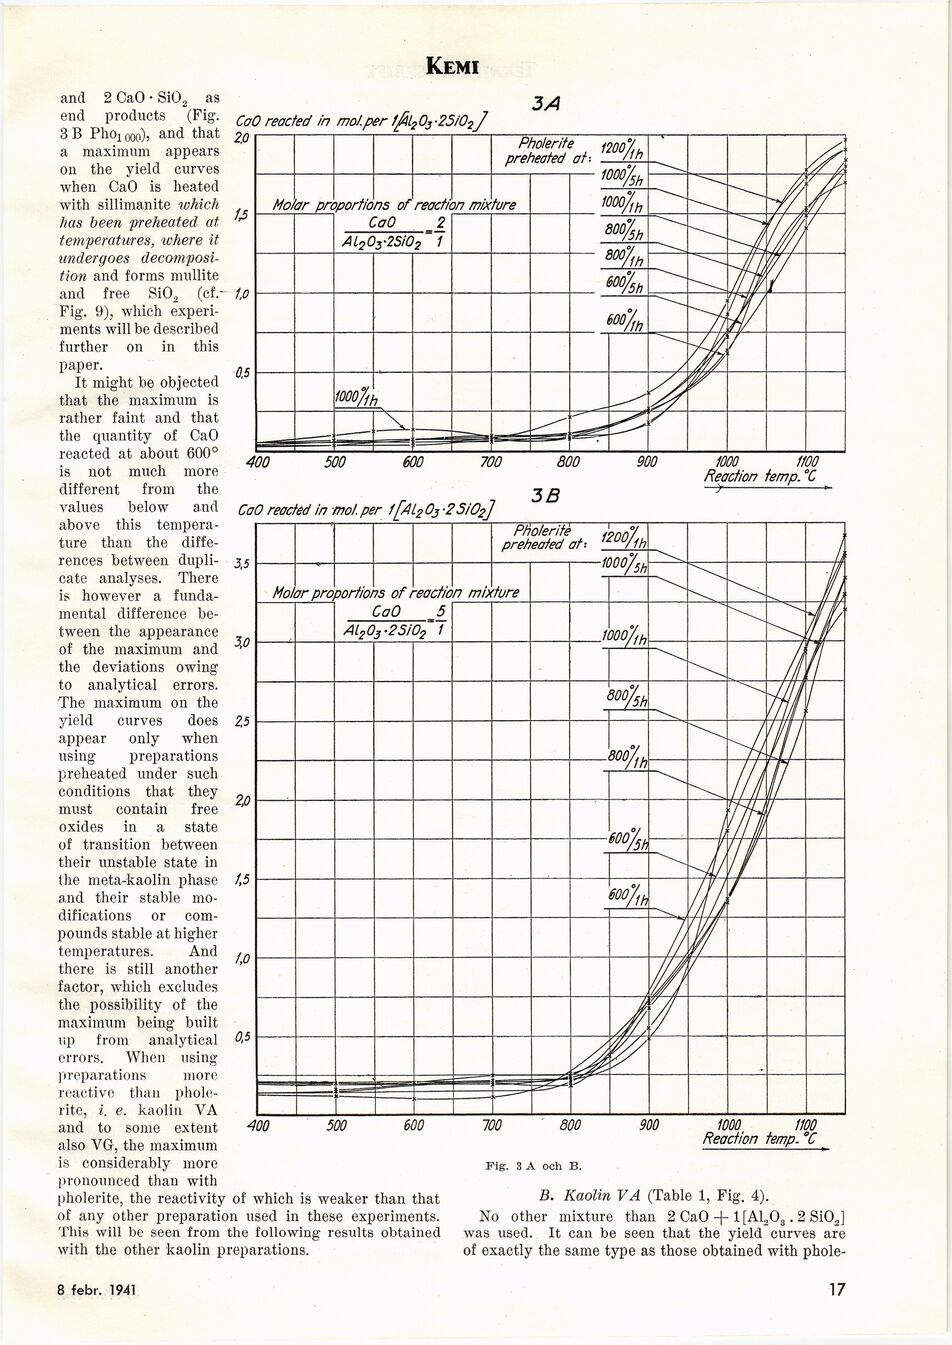
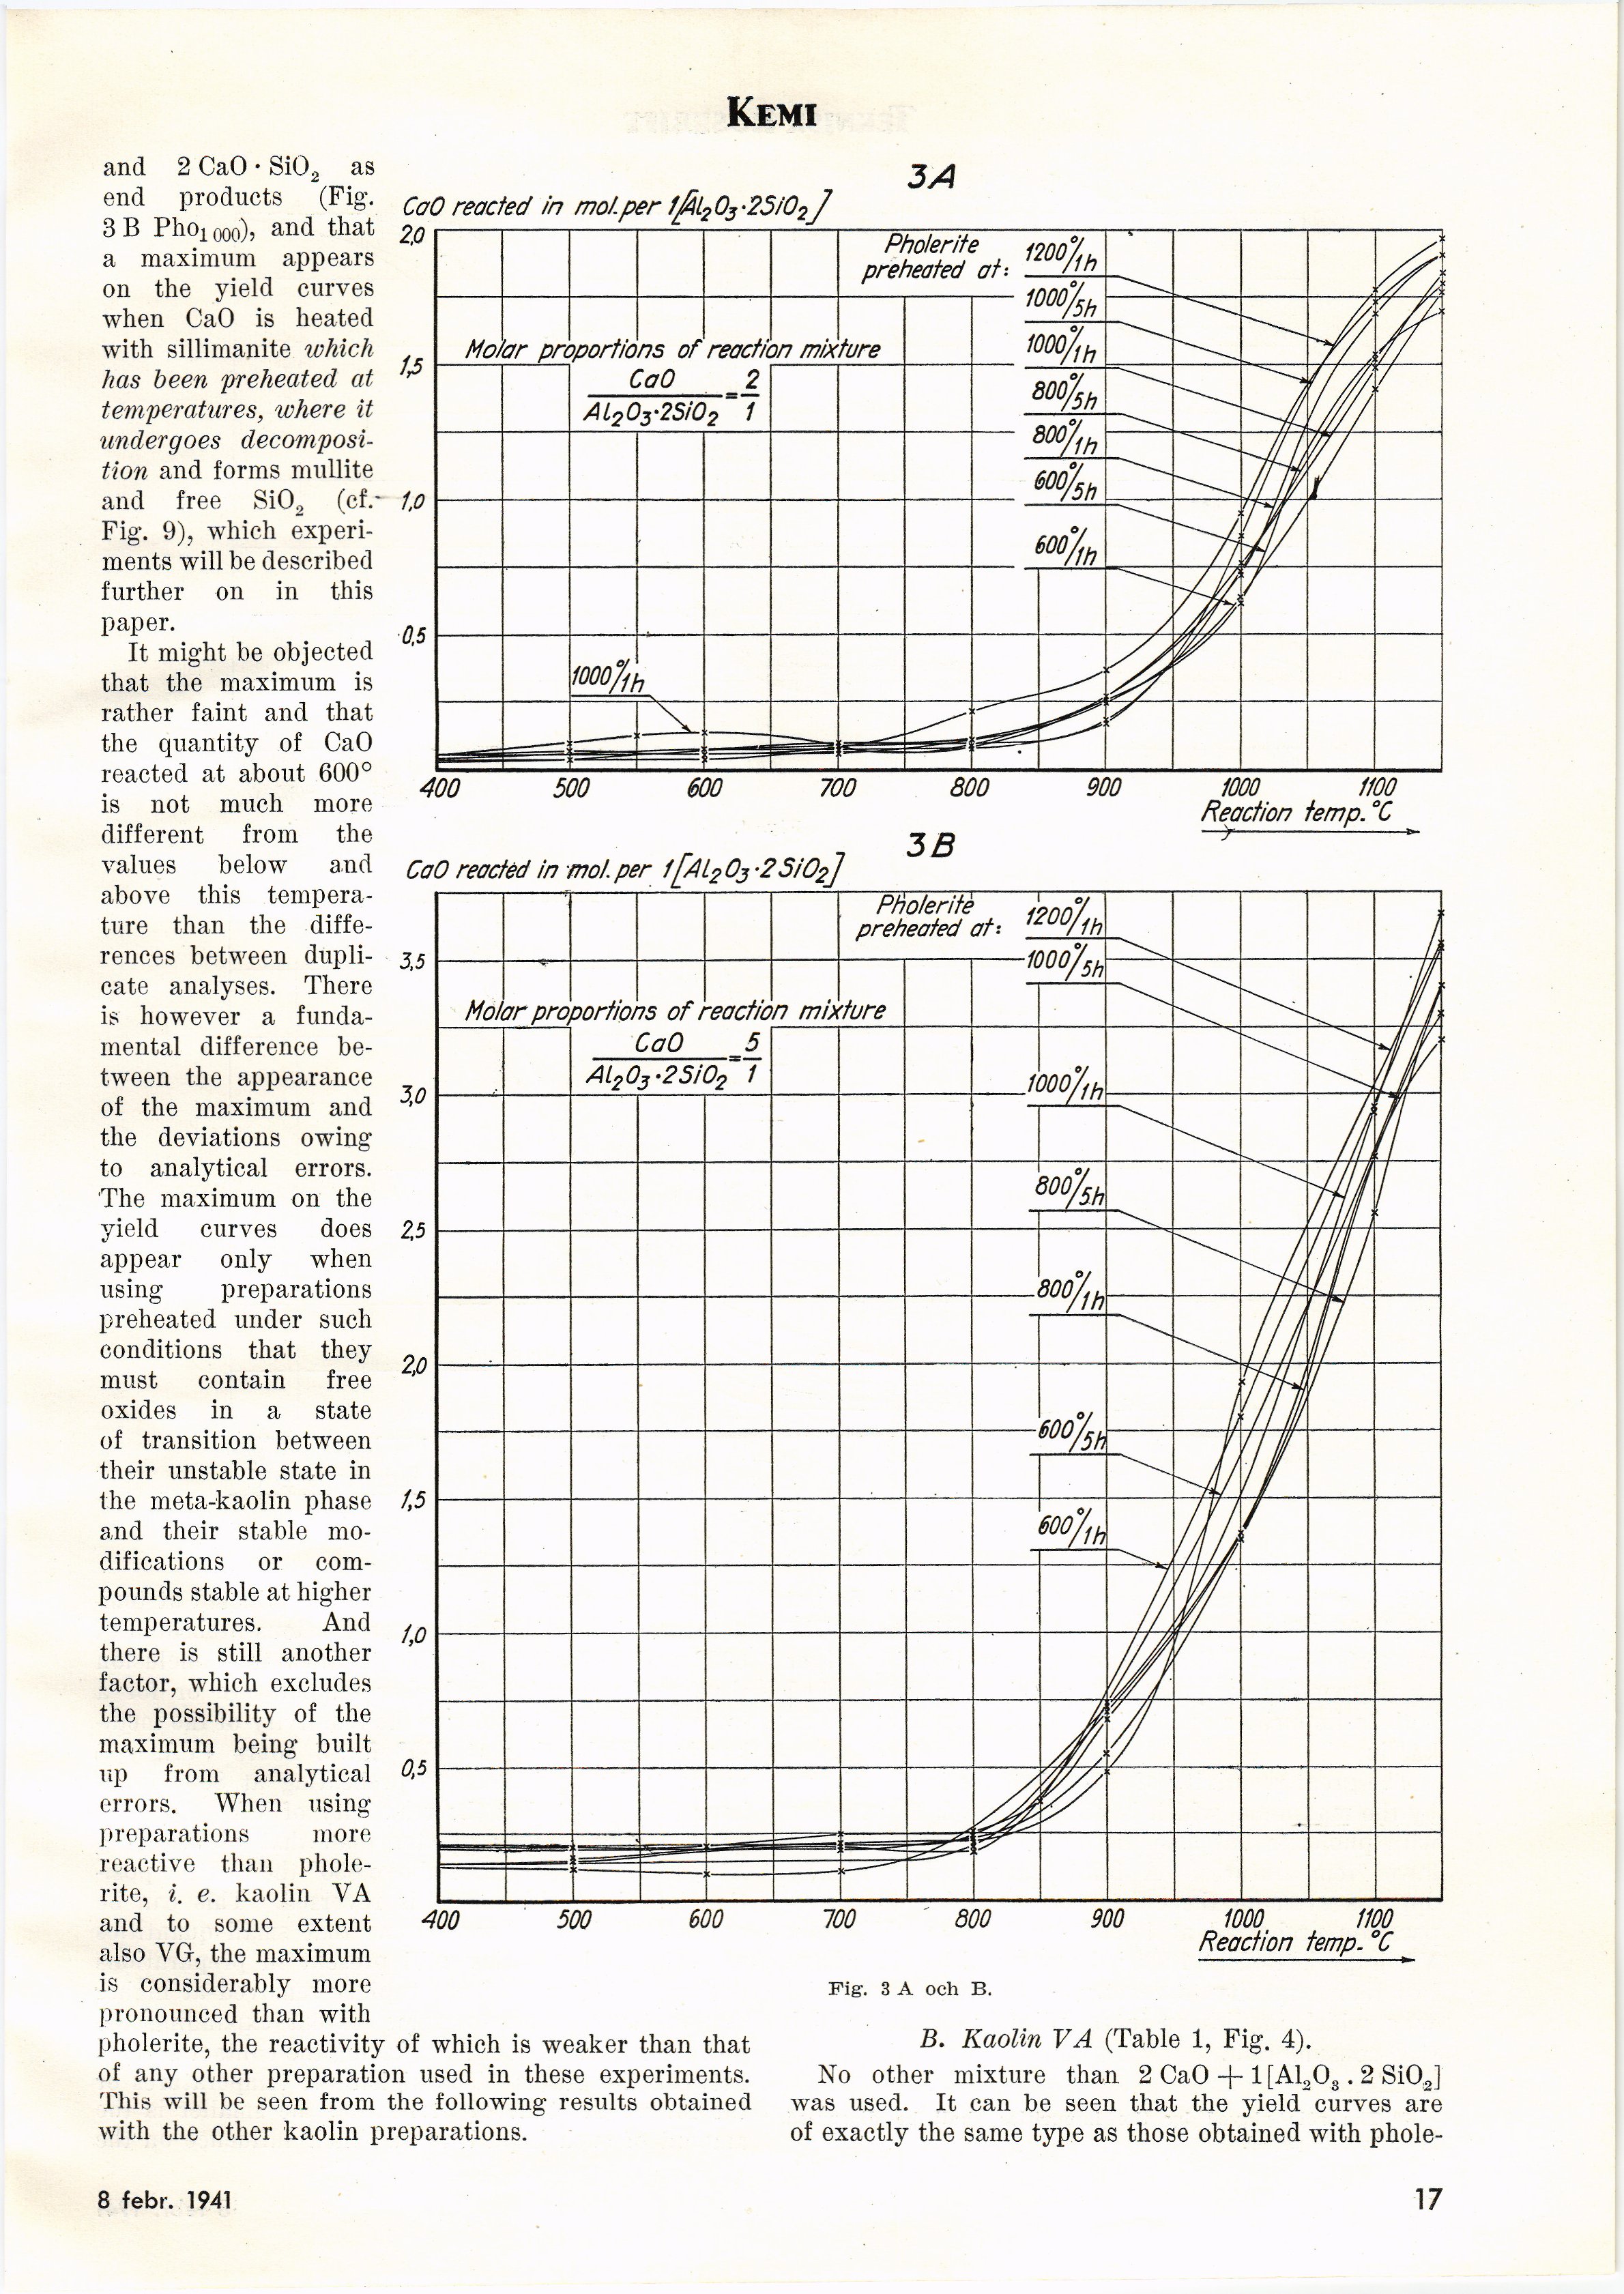
and 2 CaO • Si02 as
end products (Fig.
3 B Pho1000), and that
a maximum appears
ön the yield curves
when CaO is heated
with sillimanite which
has been preheated at
temperatures, where it
undergoes
decomposi-tion and forms mullite
and free Si02
(ef.-Fig. 9), which
experiments will be described
further ön in this
paper.
It might be objected
that the maximum is
rather faint and that
the quantity of CaO
reacted at about 600°
is not mucli möre
different from the
values below and
above this
tempera-ture than the
diffe-rences between
dupli-cate analyses. There
is however a
fundamental difference
between the appearance
of the maximum and
the deviations owing
to analytical errors.
The maximum ön the
yield curves does
appear only when
using preparations
preheated under such
conditions that they
must eontain free
oxides in a state
of transition between
their unstable state in
the meta-kaolin phase
and their stable
mo-difications or
com-pounds stable at higher
temperatures. And
there is still another
factor, which excludes
the possibility of the
maximum being built
up from analytical
errors. When using
preparations möre
reactive than
phole-rite, i. e. kaolin YA
and to some extent
also YG, the maximum
is considerably möre
pronounced than with
pholerite, the reactivity of which is weaker than that
of any other preparation used in these experiments.
This will be seen from the following results obtained
with the other kaolin preparations.
Fig. 3 A och B.
B. Kaolin VA (Table 1, Fig. 4).
No other mixture than 2 CaO + 1[A1„03. 2 SiO,]
was used. It can be seen that the yield curves are
of exactly the same type as those obtained with phole-
<< prev. page << föreg. sida << >> nästa sida >> next page >>