
Full resolution (JPEG) - On this page / på denna sida - Review of Published Data on the Humidity Dependence of the Flashover Voltage of Air Insulation, by Jarle Sletbak
<< prev. page << föreg. sida << >> nästa sida >> next page >>
Below is the raw OCR text
from the above scanned image.
Do you see an error? Proofread the page now!
Här nedan syns maskintolkade texten från faksimilbilden ovan.
Ser du något fel? Korrekturläs sidan nu!
This page has never been proofread. / Denna sida har aldrig korrekturlästs.
into account by reducing the percentage correction
in proportion to the flashover voltage below 100 kV
r.m.s. by a.c. and 141 kV peak by impulses. This
rule is, however, evidently not generally valid, but
seems to be an acceptable compromise in practice.
In the following paragraphs some observations are
referred from literature on humidity dependence
of flashover voltage.
Flashover at 50—60 c/s
Air gaps with uniform fields (sphere gaps)
It is normally observed that the flashover voltage
of sphere gaps is practically independent of air
humidity when the uniformity of the electric field
is sufficient. It is shown, however, by more exact
measurements with alternating voltages on a 2 cm
sphere gap2 that the flashover voltage increases
0,13 % per g/m3. This is in agreement with
measurements made on 12,5 cm spheres by the National
Bureau of Standards, indicating an increase of 0,14
% per g/m3. Measurements in uniform fields3
(Ro-gowski gaps) with up to 2 cm electrode distance
gave an increase of 0,25 % per g/m3.
Consequently, the flashover voltage of sphere gaps,
anyway the smaller ones, is to certain degree
dependent on air humidity. This influences the
accuracy of sphere gap measurements, but at present
there seems to be insufficient data to introduce a
humidity correction factor.
Air gaps with non-uniform fields (rod gaps)
All published data concerning rod gaps indicate
an almost linear increase of flashover voltage with
increasing humidity, independent of temperature.
At the higher humidities (above approx. 20 g/m3) the
curves will tend to become horizontal. The curves
level out more pronounced and at lower humidity
when the electrode distance increases 4’B0.
The influence of the electrode shape on humidity
correction has been examined by Lebacqz0, who
found this influence negligible. All electrodes
ending in a single well-defined point gave consistent
results, while the results are erratic by other
electrode shapes when the spacing is small. In
particular it is mentioned that electrodes of 9/16" round
rod cut perpendicular to its axis gave erratic
results at all spacings studied (up to 18 inches), and
the flashover voltage was higher than for other
electrodes.
Flashover of insulators
Most authors have found that the flashover voltage
of insulators increases proportionally with absolute
humidity up to a critical relative humidity of about
60—80 %. At higher relative humidities the
flash-over voltage decreases and becomes erratic. When
the insulator is heated above air temperature, the
decrease in flashover voltage disappears. When it
is subjected to repeated flashover tests at high
humidities, the flashover voltage increases
gradually to a maximum which is reached after
approximately 25 flashovers*. It is believed that these
phenomena are due to formation of a thin water film on
the insulator surface when the relative humidity
exceeds a critical value. This explanation is
supported by surface resistance measurements carried out
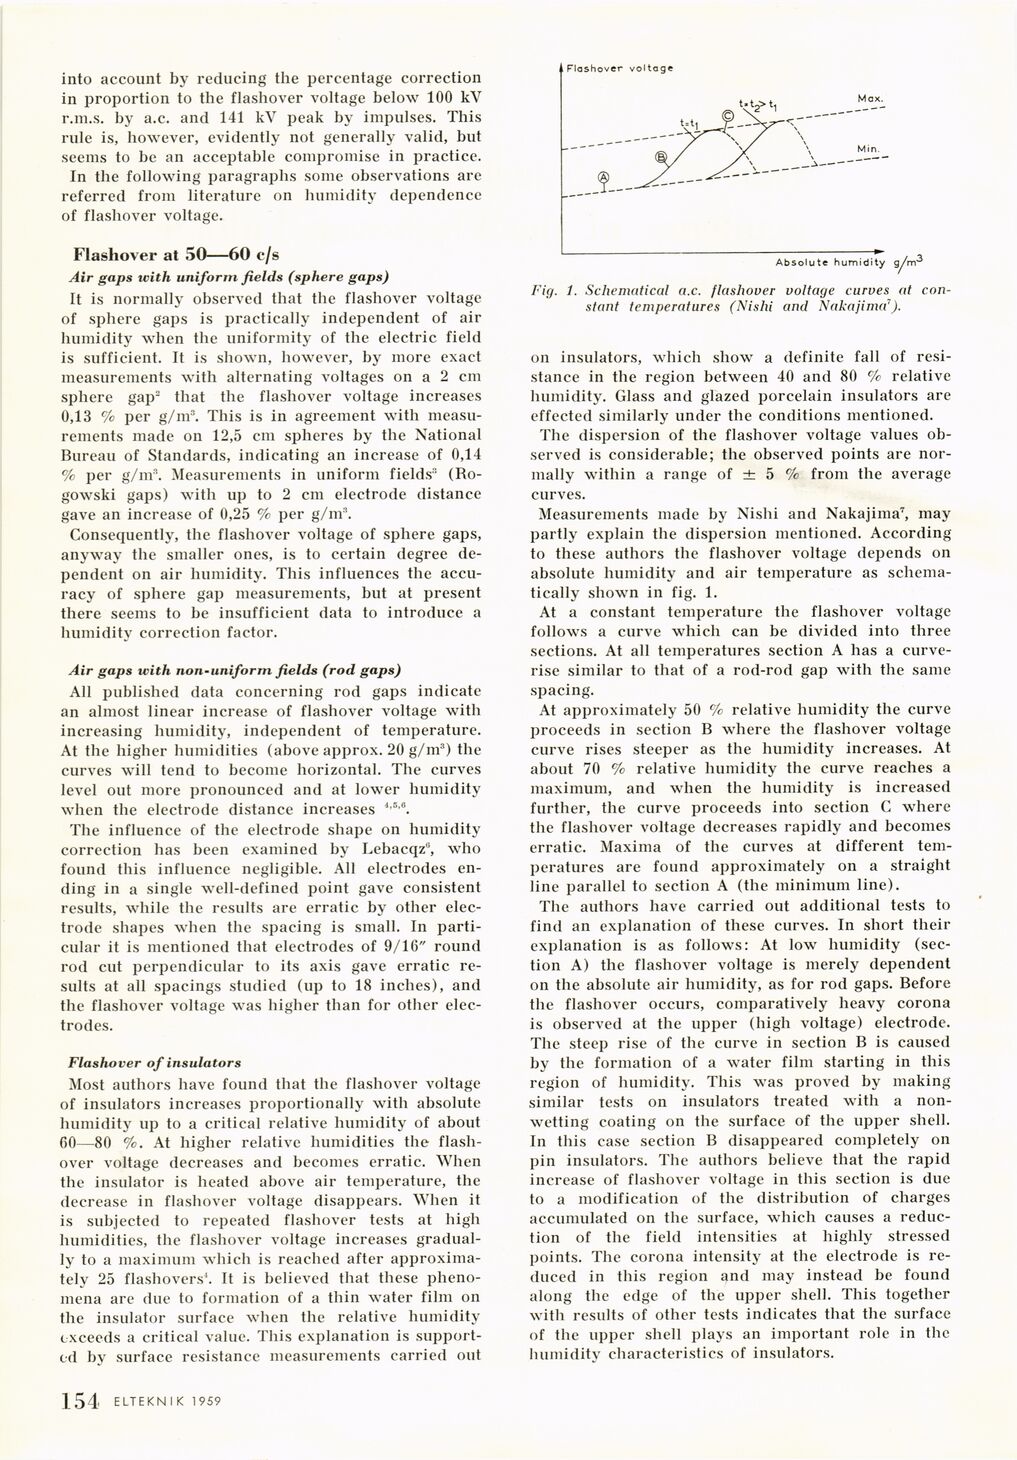
Fig. 1. Schematical a.c. flashover voltage curves at
constant temperatures (Nishi and Nakajima7).
on insulators, which show a definite fall of
resistance in the region between 40 and 80 % relative
humidity. Glass and glazed porcelain insulators are
effected similarly under the conditions mentioned.
The dispersion of the flashover voltage values
observed is considerable; the observed points are
normally within a range of ± 5 % from the average
curves.
Measurements made by Nishi and Nakajima7, may
partly explain the dispersion mentioned. According
to these authors the flashover voltage depends on
absolute humidity and air temperature as
schematically shown in fig. 1.
At a constant temperature the flashover voltage
follows a curve which can be divided into three
sections. At all temperatures section A has a
curve-rise similar to that of a rod-rod gap with the same
spacing.
At approximately 50 % relative humidity the curve
proceeds in section B where the flashover voltage
curve rises steeper as the humidity increases. At
about 70 % relative humidity the curve reaches a
maximum, and when the humidity is increased
further, the curve proceeds into section C where
the flashover voltage decreases rapidly and becomes
erratic. Maxima of the curves at different
temperatures are found approximately on a straight
line parallel to section A (the minimum line).
The authors have carried out additional tests to
find an explanation of these curves. In short their
explanation is as follows: At low humidity
(section A) the flashover voltage is merely dependent
on the absolute air humidity, as for rod gaps. Before
the flashover occurs, comparatively heavy corona
is observed at the upper (high voltage) electrode.
The steep rise of the curve in section B is caused
by the formation of a water film starting in this
region of humidity. This was proved by making
similar tests on insulators treated with a
non-wetting coating on the surface of the upper shell.
In this case section B disappeared completely on
pin insulators. The authors believe that the rapid
increase of flashover voltage in this section is due
to a modification of the distribution of charges
accumulated on the surface, which causes a
reduction of the field intensities at highly stressed
points. The corona intensity at the electrode is
reduced in this region and may instead be found
along the edge of the upper shell. This together
with results of other tests indicates that the surface
of the upper shell plays an important role in the
humidity characteristics of insulators.
.154 ELTEKNIK 1959
<< prev. page << föreg. sida << >> nästa sida >> next page >>