
Full resolution (JPEG) - On this page / på denna sida - 1958, H. 5 - Flashover Characteristics of Non-uniform Spark Gaps with Standard 1×50 Impulses, by Jörgen Fryxell
<< prev. page << föreg. sida << >> nästa sida >> next page >>
Below is the raw OCR text
from the above scanned image.
Do you see an error? Proofread the page now!
Här nedan syns maskintolkade texten från faksimilbilden ovan.
Ser du något fel? Korrekturläs sidan nu!
This page has never been proofread. / Denna sida har aldrig korrekturlästs.
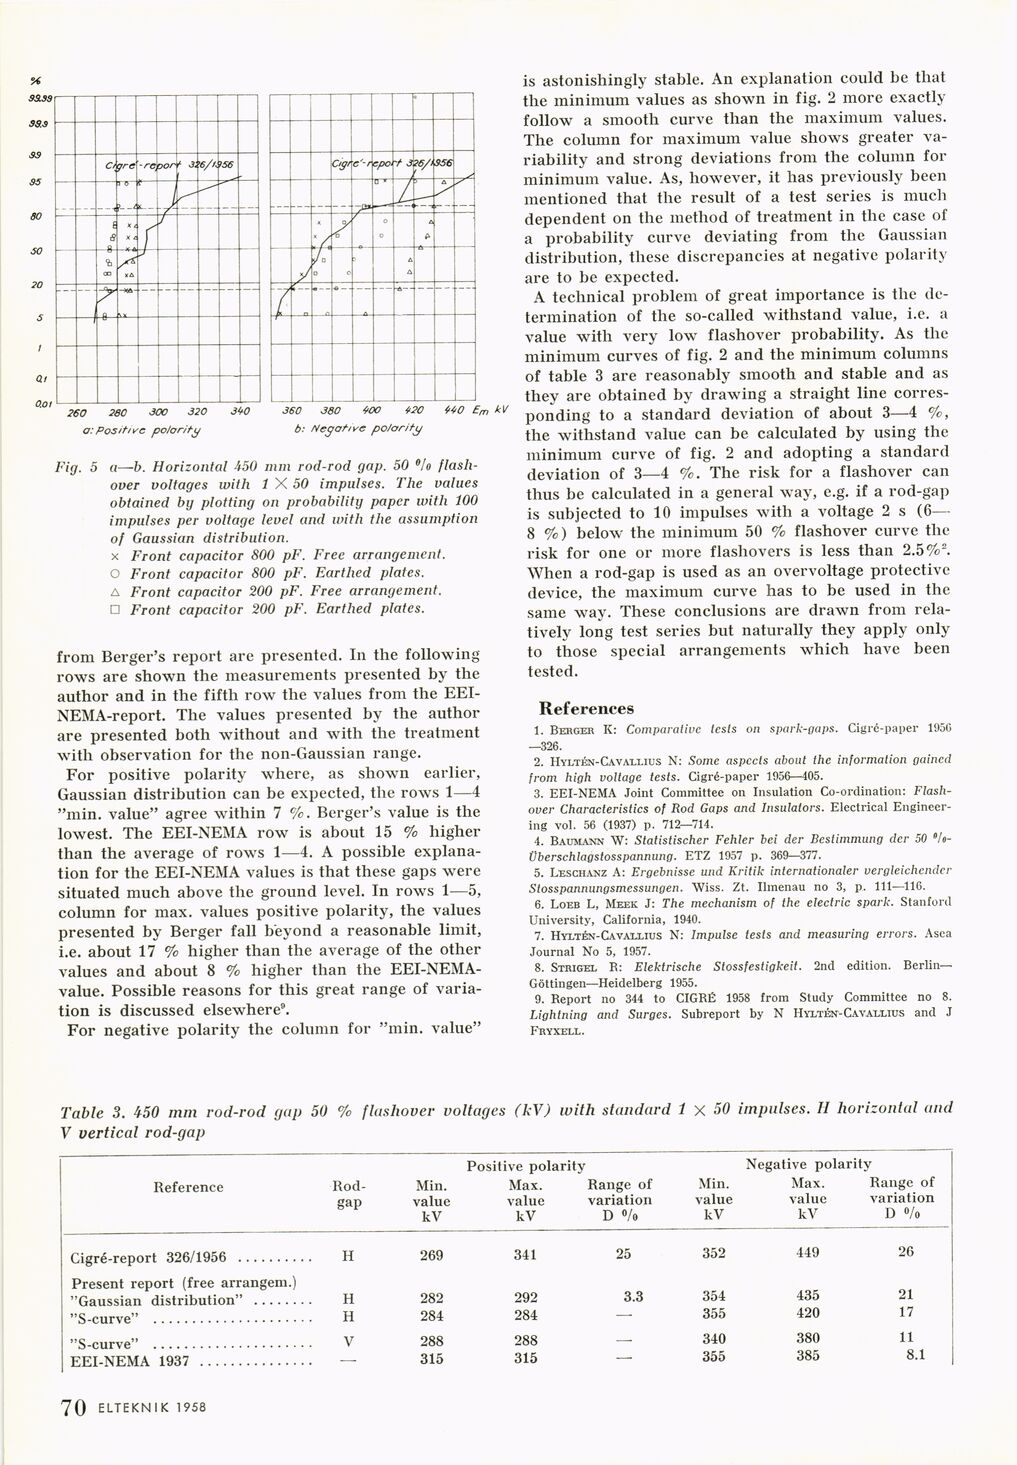
Fig. 5 a—b. Horizontal 450 mm rod-rod gap. 50 °!o
flash-over voltages with 1 X 50 impulses. The values
obtained by plotting on probability paper with 100
impulses per voltage level and with the assumption
of Gaussian distribution.
x Front capacitor 800 pF. Free arrangement.
O Front capacitor 800 pF. Earthed plates.
A Front capacitor 200 pF. Free arrangement.
□ Front capacitor 200 pF. Earthed plates.
from Berger’s report are presented. In the following
rows are shown the measurements presented by the
author and in the fifth row the values from the
EEI-NEMA-report. The values presented by the author
are presented both without and with the treatment
with observation for the non-Gaussian range.
For positive polarity where, as shown earlier,
Gaussian distribution can be expected, the rows 1—4
"min. value" agree within 7 °/c. Berger’s value is the
lowest. The EEI-NEMA row is about 15 % higher
than the average of rows 1—4. A possible
explanation for the EEI-NEMA values is that these gaps were
situated much above the ground level. In rows 1—5,
column for max. values positive polarity, the values
presented by Berger fall beyond a reasonable limit,
i.e. about 17 % higher than the average of the other
values and about 8 % higher than the
EEI-NEMA-value. Possible reasons for this great range of
variation is discussed elsewhere9.
For negative polarity the column for "min. value"
is astonishingly stable. An explanation could be that
the minimum values as shown in fig. 2 more exactly
follow a smooth curve than the maximum values.
The column for maximum value shows greater
variability and strong deviations from the column for
minimum value. As, however, it has previously been
mentioned that the result of a test series is much
dependent on the method of treatment in the case of
a probability curve deviating from the Gaussian
distribution, these discrepancies at negative polarity
are to be expected.
A technical problem of great importance is the
determination of the so-called withstand value, i.e. a
value with very low flashover probability. As the
minimum curves of fig. 2 and the minimum columns
of table 3 are reasonably smooth and stable and as
they are obtained by drawing a straight line
corresponding to a standard deviation of about 3—-4 %,
the withstand value can be calculated by using the
minimum curve of fig. 2 and adopting a standard
deviation of 3—4 %. The risk for a flashover can
thus be calculated in a general way, e.g. if a rod-gap
is subjected to 10 impulses with a voltage 2 s (6—
8 %) below the minimum 50 % flashover curve the
risk for one or more flasliovers is less than 2.5%".
When a rod-gap is used as an overvoltage protective
device, the maximum curve has to be used in the
same way. These conclusions are drawn from
relatively long test series but naturally they apply only
to those special arrangements which have been
tested.
References
1. Berger K: Comparative tests on spark-gaps. Cigre-paper 195G
—326.
2. Hyltén-Cavallius N: Some aspccts about the information gained
from high voltage tests. Cigré-paper 1956—405.
3. EEI-NEMA Joint Committee on Insulation Co-ordination:
Flash-over Characteristics of Rod Gaps and Insulators. Electrical
Engineering vol. 56 (1937) p. 712—714.
4. Baumann W: Statistischer Fehler bei der Bcstimmung der 50
°/o-überschlagstosspannung. ETZ 1957 p. 369—377.
5. Leschanz A: Ergebnisse und Kritik internationaler vergleichcndcr
Stosspannungsmessungen. Wiss. Zt. Ilmenau no 3, p. Ill—116.
6. Loeb L, Meek J: The mechanism of the electric spark. Stanford
University, California, 1940.
7. Hyltén-Cavallius N: Impulse tests and measuring errors. Asea
Journal No 5, 1957.
8. Strigel B: Elektrische Stossfestigkeit. 2nd edition.
Berlin-Göttingen—Heidelberg 1955.
9. Beport no 344 to CIGBÉ 1958 from Study Committee no 8.
Lightning and Surges. Subreport by N Hyltén-Cavallius and J
Fryxell.
Table 3. 450 mm rod-rod gap 50 % flashover voltages (kV) with standard 1 X 50 impulses. II horizontal and
V vertical rod-gap
Positive polarity Negative polarity
Reference Rod- Min. Max. Range of Min. Max. Range of
gap value value variation value value variation
kV kV D «/o kV kV D °/o
Cigré-report 326/1956 ......... H 269 341 25 352 449 26
Present report (free arrangem.)
"Gaussian distribution" ....... H 282 292 3.3 354 435 21
"S-curve" .................... H 284 284 — 355 420 17
"S-curve" .................... V 288 288 — 340 380 11
EEI-NEMA 1937 .............. — 315 315 — 355 385 8.1
1 70 ELTEKN I K 1958
<< prev. page << föreg. sida << >> nästa sida >> next page >>