
Full resolution (TIFF) - On this page / på denna sida - N:o 5 - Pages ...
<< prev. page << föreg. sida << >> nästa sida >> next page >>
Below is the raw OCR text
from the above scanned image.
Do you see an error? Proofread the page now!
Här nedan syns maskintolkade texten från faksimilbilden ovan.
Ser du något fel? Korrekturläs sidan nu!
This page has never been proofread. / Denna sida har aldrig korrekturlästs.
PENNIA 66, N:o 5
25
Ostrobothnia is so appreciable that the mean volume on productive
forest land in the whole of South Finland (84.4 m3) has proved to be
approximately the same and for the whole country nearly the same
(74.8 m3) as in 1922—23 (84.7 and 75.6 m3). If the inaccuracy in the
previous volume of deciduous trees is corrected, the figures now
obtained are slightly higher than the former ones.
The nominal decrease in the mean volume of the total forest area
by 1.5 m3 indicated by the results, though the decrease on
productive and poor productive forest land is less, seems inconsistent, but
is due to the fact that the division of the forest area between
productive and poor productive forest land has changed slightly in favour
of the latter (see page 12). In this connection, however, the
uncertainty of small differences should be stressed, though it will not be
discussed until the figures are checked later on the basis of the
calculation of probability.
The division of the volume of the growing stock according to
species of trees is dealt with later, but it should be mentioned
that the proportions of the different species to the mean volume are
as follows:
Pine Spruce Birch Aspen Alder Total
South Finland .......... 32.2 24.7 14.4 1.7 1.8 74.8 m3/ha
North Finland .......... 23.4 14.2 8.6 0.5 O.o 46.7 »
Whole country ......... 28.4 20.2 11.9 1.2 l.i 62.8 »
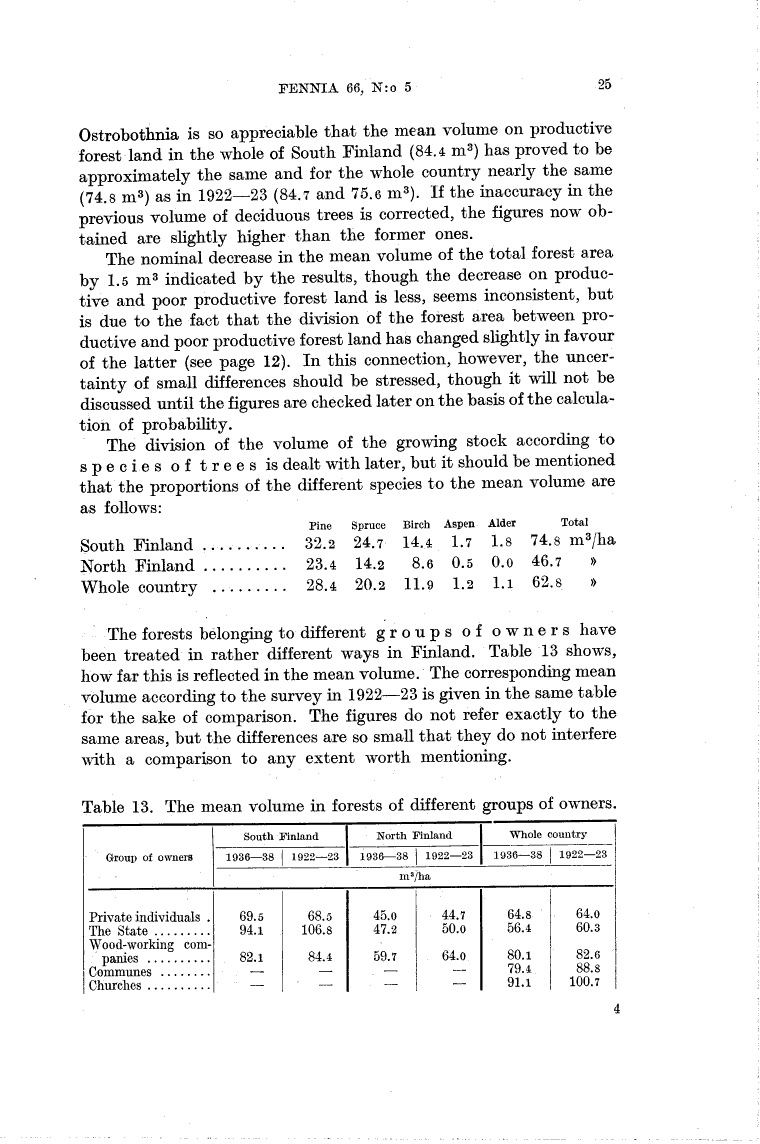
The forests belonging to different groups of owners have
been treated in rather different ways in Finland. Table 13 shows,
how far this is reflected in the mean volume. The corresponding mean
volume according to the survey in 1922—23 is given in the same table
for the sake of comparison. The figures do not refer exactly to the
same areas, but the differences are so small that they do not interfere
with a comparison to any extent worth mentioning.
Table 13. The mean volume in forests of different groups of owners.
Group of owners South Finland North Finland Whole country
1936—38 1 1922—23 1936—38 1 1922—23 1936—38 1 1922—23
m3/ha
Private individuals . 69.0 68.5 45.0 44.7 64.8 64.0
The State......... 94.1 106.8 47.2 50.0 56.4 60.3
Wood-working
companies .......... . 82.1 84.4 59.7 64.0 80.1 82.6
Communes ........ —. —. .—. __ 79.4 88.8
Churches.......... — — — — 91.1 100.7
2
<< prev. page << föreg. sida << >> nästa sida >> next page >>