
Full resolution (TIFF) - On this page / på denna sida - N:o 5 - Pages ...
<< prev. page << föreg. sida << >> nästa sida >> next page >>
Below is the raw OCR text
from the above scanned image.
Do you see an error? Proofread the page now!
Här nedan syns maskintolkade texten från faksimilbilden ovan.
Ser du något fel? Korrekturläs sidan nu!
This page has never been proofread. / Denna sida har aldrig korrekturlästs.
36
Yrjö Ilvessalo, The Forest .’Resources’ of Finland in 1936—1938
the growth. The cubic metre of solid measure (m3) was used as the
measure of growth, as in calculating the growing stock.
The growth was calculated excluding bark, so that the actual
growth of the wood was obtained. The growth of the bark is totally
different in importance and value, besides being negative on its outer
surface, on account of which it was not included in the calculations.
For this reason, too, in calculating the growth percentage, the tree
excluding bark has been taken as a basis and consequently, too, the
diameter and basal area excluding bark. The calculation of the growth
percentage in 1922—23 was carried out in a different way which was
usual at that time—though it must be considered incorrect—i.e.
on the basis of diameters including bark. Owing to the difference in
the methods of calculation the growth percentage of a tree of the same
growth and size is now slightly higher. The difference varies
considerably according to the breast-height diameter, the thickness of the
bark and the radial increment. According to calculations made on the
basis of about 200 sample plots, the average variation in the figure
of the percentage is about 0.2—0.3 or 5—8 per cent of the growth
percentage itself. This should be borne in mind in comparing the
present growth with the results of the survey in 1922—23.
The volume growth percentage will be dealt with first, then the
average growth per hectare and finally the total growth.
a. The volume growth percentage.
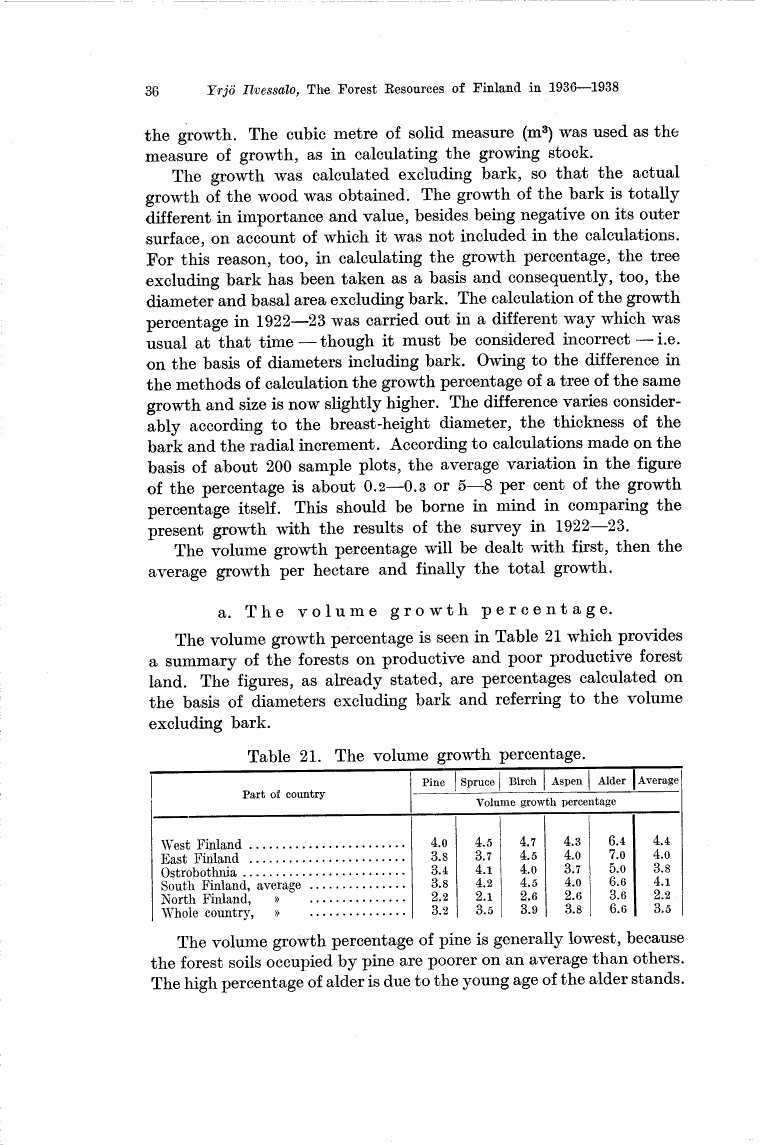
The volume growth percentage is seen in Table 21 which provides
a summary of the forests on productive and poor productive forest
land. The figures, as already stated, are percentages calculated on
the basis of diameters excluding bark and referring to the volume
excluding bark.
Table 21. The volume growth percentage.
Part of country Pine Spruce j Birch Aspen Alder Average
Volume growth percentage
West Finland...................... 4.0 4.5 4.7 4.3 6.4 4.4
East Finland ................... 3.8 3.7 4.5 4.0 7.0 4.0
Ostrobothnia................... 3.4 4.1 4.0 3.7 5.0 3.8
South Finland, average ............. 3.8 4.2 4.5 4.0 6.6 4.1
North Finland, » ............. 2.2 2.1 2.6 2.6 3.6 2.2
Whole country, » ......... 3.2 3.5 3.9 3.8 6.6 3.5
The volume growth percentage of pine is generally lowest, because
the forest soils occupied by pine are poorer on an average than others.
The high percentage of alder is due to the young age of the alder stands.
<< prev. page << föreg. sida << >> nästa sida >> next page >>