
Full resolution (JPEG) - On this page / på denna sida - Sidor ...
<< prev. page << föreg. sida << >> nästa sida >> next page >>
Below is the raw OCR text
from the above scanned image.
Do you see an error? Proofread the page now!
Här nedan syns maskintolkade texten från faksimilbilden ovan.
Ser du något fel? Korrekturläs sidan nu!
This page has never been proofread. / Denna sida har aldrig korrekturlästs.
En nærmere Berorelse meel Havbunden og dens
dyriske Liv har altsaa ingen mærkbar Indflydelse paa Havets
Sammensætning med Hensyn til disse Bestanddele.
Middeltallene for Svovlsyre viser større Afvigelser end de
tilsvarende for Magnesia, skjønt man skulde liave ventet, at
det Modsatte havde fundet Sted. Forskellighederne er dog
i dette Tilfælde ligesom i de foregaaende for ubetydelige
til at kunne afgive noget bestemt Bevis for. at der virkelig
existerer nogen tilsvarende Eiéndommelighed i Havet. At
Svovlsyregehalten i de mellemliggende Dyb skulde være
høiere end ved Bunden og Overfladen, er en Antagelse,
der a priori ikke har nogen Sandsynlighed for sig.
.Jeg kommer senere muligens tilbage til disse
Spørgsmaal angaaende Havets Beskaffenhed i Dybet, da jeg for
Øieblikket er ifærd meel at undersøge ele Prøver, som
under Expeditionen Dybdemaalinger optoges af Havbunden.
Efter ele foreløbige Resultater i denne Retning anser jeg
mig imidlertid berettiget til at antage, at dette
Dybvands-slam er af en temmelig ensartet Beskaffenhed.
Forat betragte de her foreliggende Bestemmelser fra
et andet Synspunkt, har jeg i efterfølgende Tabel ordnet
Middel- og Forholdstallene for Søvandets Bestanddele efter
de Breddegrader, mellem hvilke Vandprøverne er optagne.
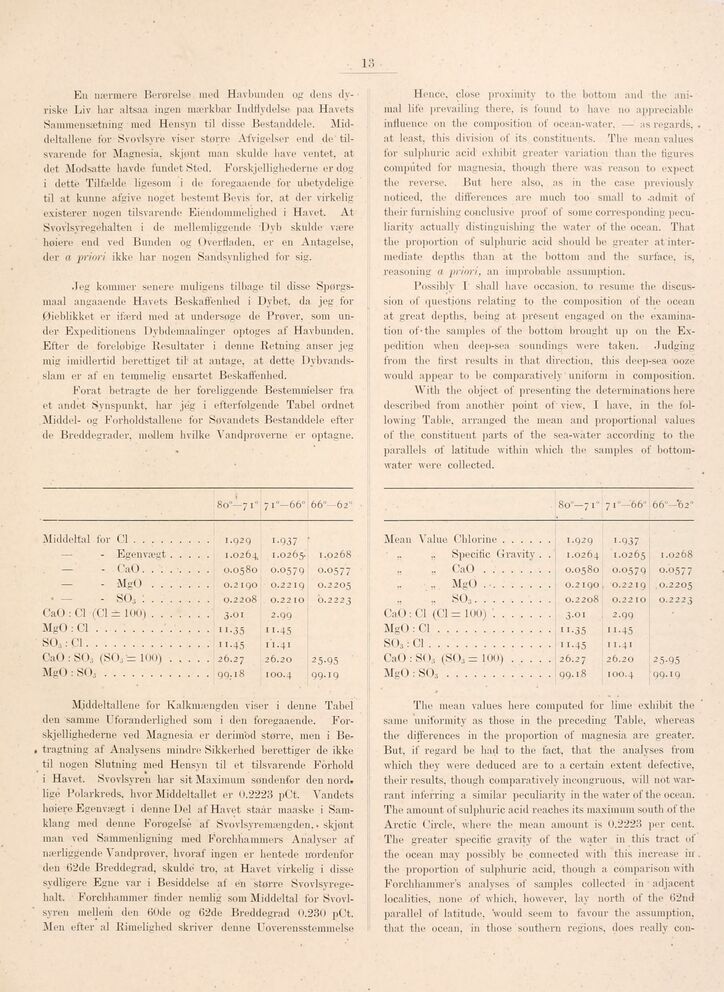
80°—71° 71"—66" 66"—62"
Middeltal for Gl....... . . 1.929 1-937
— - Egenvægt . . . . . 1.0264. [.0265. 1.0268
- - CaO...... . . 0.0580 0.0579 0-0577
- - MgO..... 0.2219 0.2205
- SOs :..... 0.2210 0.2223
CaO : CI (CI - 100)..... • • 3-01 2.99
MgO: CI........... • • 11-35 11-45
SO, : Gl............ • • 11-45 11.41
CaO : SO3 (SO,’= 100) . . . . . 26.27 26.20 25-95
MgO: SO,.......... . . 99.18 100.4 99.19
Middeltallene for Kalkniængelen viser i denne Tabel
den samme Uforanderlighed som i den foregaaende.
Forskellighederne ved Magnesia er derimod støn-e, men i
Be-• tragtning af Analysens mindre Sikkerhed berettiger de ikke
til nogen Slutning meel Hensyn til et tilsvarende Forhold
i Havet. Svovlsyren har sit Maximum söndenfor elen nord*
lige Polarkreds, hvor Middeltallet er 0.2223 pCt. Vandets
høiere Egenvægt i denne Del af Havet staar maaske i
Samklang meel denne Forøgelse af Svovlsyremængden.. skjønt
man ved Sammenligning meel Forchhammers Analyser af
nærliggende Vandprøver, hvoraf ingen er hentede nordenfor
elen 62de Breddegrad, skulde tro, at Havet virkelig i disse
sydligere Egne var i Besiddelse af en større
Svovlsyrege-halt. Forchhammer finder nemlig som Middeltal for
Svovlsyren mellem den 60ele og 62de Breddegrad 0.230 pCt.
Men efter al Rimelighed skriver denne Uoverensstemmelse
Hence, close proximity to the bottom and the
animal life prevailing there, is found to have no appreciable
influence on the composition of ocean-water. — as regards,
at least, this division of its constituents. The mean values
for sulphuric acid exhibit greater variation than the figures
computed for magnesia, though there was reason to expect
the reverse. But here also, as in the case previously
noticed, the differences are much too small to .admit of
their furnishing conclusive proof of some corresponding
peculiarity actually distinguishing the water of the ocean. That
the proportion of sulphuric aciel should be greater at
intermediate depths than at the bottom and the surface, is,
reasoning a priori, an improbable assumption.
Possibly I shall have occasion, to resume the
discussion of questions relating to the composition of the ocean
at great depths, being at present engaged on the
examination of-the samples of the bottom brought up ou the
Expedition when eleep-sea soundings were taken. Judging
from the first results in that direction, this deep-sea ooze
would appear to be comparatively uniform in composition.
With the object of presenting the determinations here
described from another point of view. I have, in the
following Table, arranged the mean and proportional values
of the constituent parts of the sea-water according to the
parallels of latitude within which the samples of
bottom-water were collected.
80"—71" 71"—66" 66"—’62°
Mean Value Chlorine...... 1.929 1-937
„ Specific Gravity . . 1.0264 1.0265 1.0268
., CaO........ 0.0580 0.0579 0.0577
.. MgO........ 0.2190 . 0.2219 0.2205
SO,......... 0.2208 0.2210 0.2223
CaO: CI (Gl - 100) ....... 3-OI 2.99
MgO :C1............. 11-35 11-45
S03 : CI.............. 11-45 11.41
CaO : SO, (SO, - 100)..... 26.27 26.20 25-95
MgO 99.18 100.4 99.19
The mean values here computed for lime exhibit the
same uniformity as those in the preceding Table, whereas
the differences in the proportion of magnesia are greater.
But, if regard be had to the fact, that the analyses from
which they were deduced are to a certain extent defective,
their results, though comparatively incongruous, will not
warrant inferring a similar peculiarity in the water of the ocean.
The amount of sulphuric acid reaches its maximum south of the
Arctic Circle, where the mean amount is 0.2223 per cent.
The greater specific -gravity of the water in this tract of
the ocean may possibly be connected with this increase in .
the proportion of sulphuric acid, though a comparison with
Forchhammers analyses of samples collected in aeljacent
localities, none of which, however, lay north of the 62nd
parallel of latitude, would seem to favour the assumption,
that the ocean, in those southern regions, does really con-
<< prev. page << föreg. sida << >> nästa sida >> next page >>