
Full resolution (JPEG) - On this page / på denna sida - Sidor ...

<< prev. page << föreg. sida << >> nästa sida >> next page >>
Below is the raw OCR text
from the above scanned image.
Do you see an error? Proofread the page now!
Här nedan syns maskintolkade texten från faksimilbilden ovan.
Ser du något fel? Korrekturläs sidan nu!
This page has never been proofread. / Denna sida har aldrig korrekturlästs.
IS
Den gjennemsnitlige Afvigelse af en enkelt
Bestemmelse fra Medium bliver = + 06.045 ( = MF).
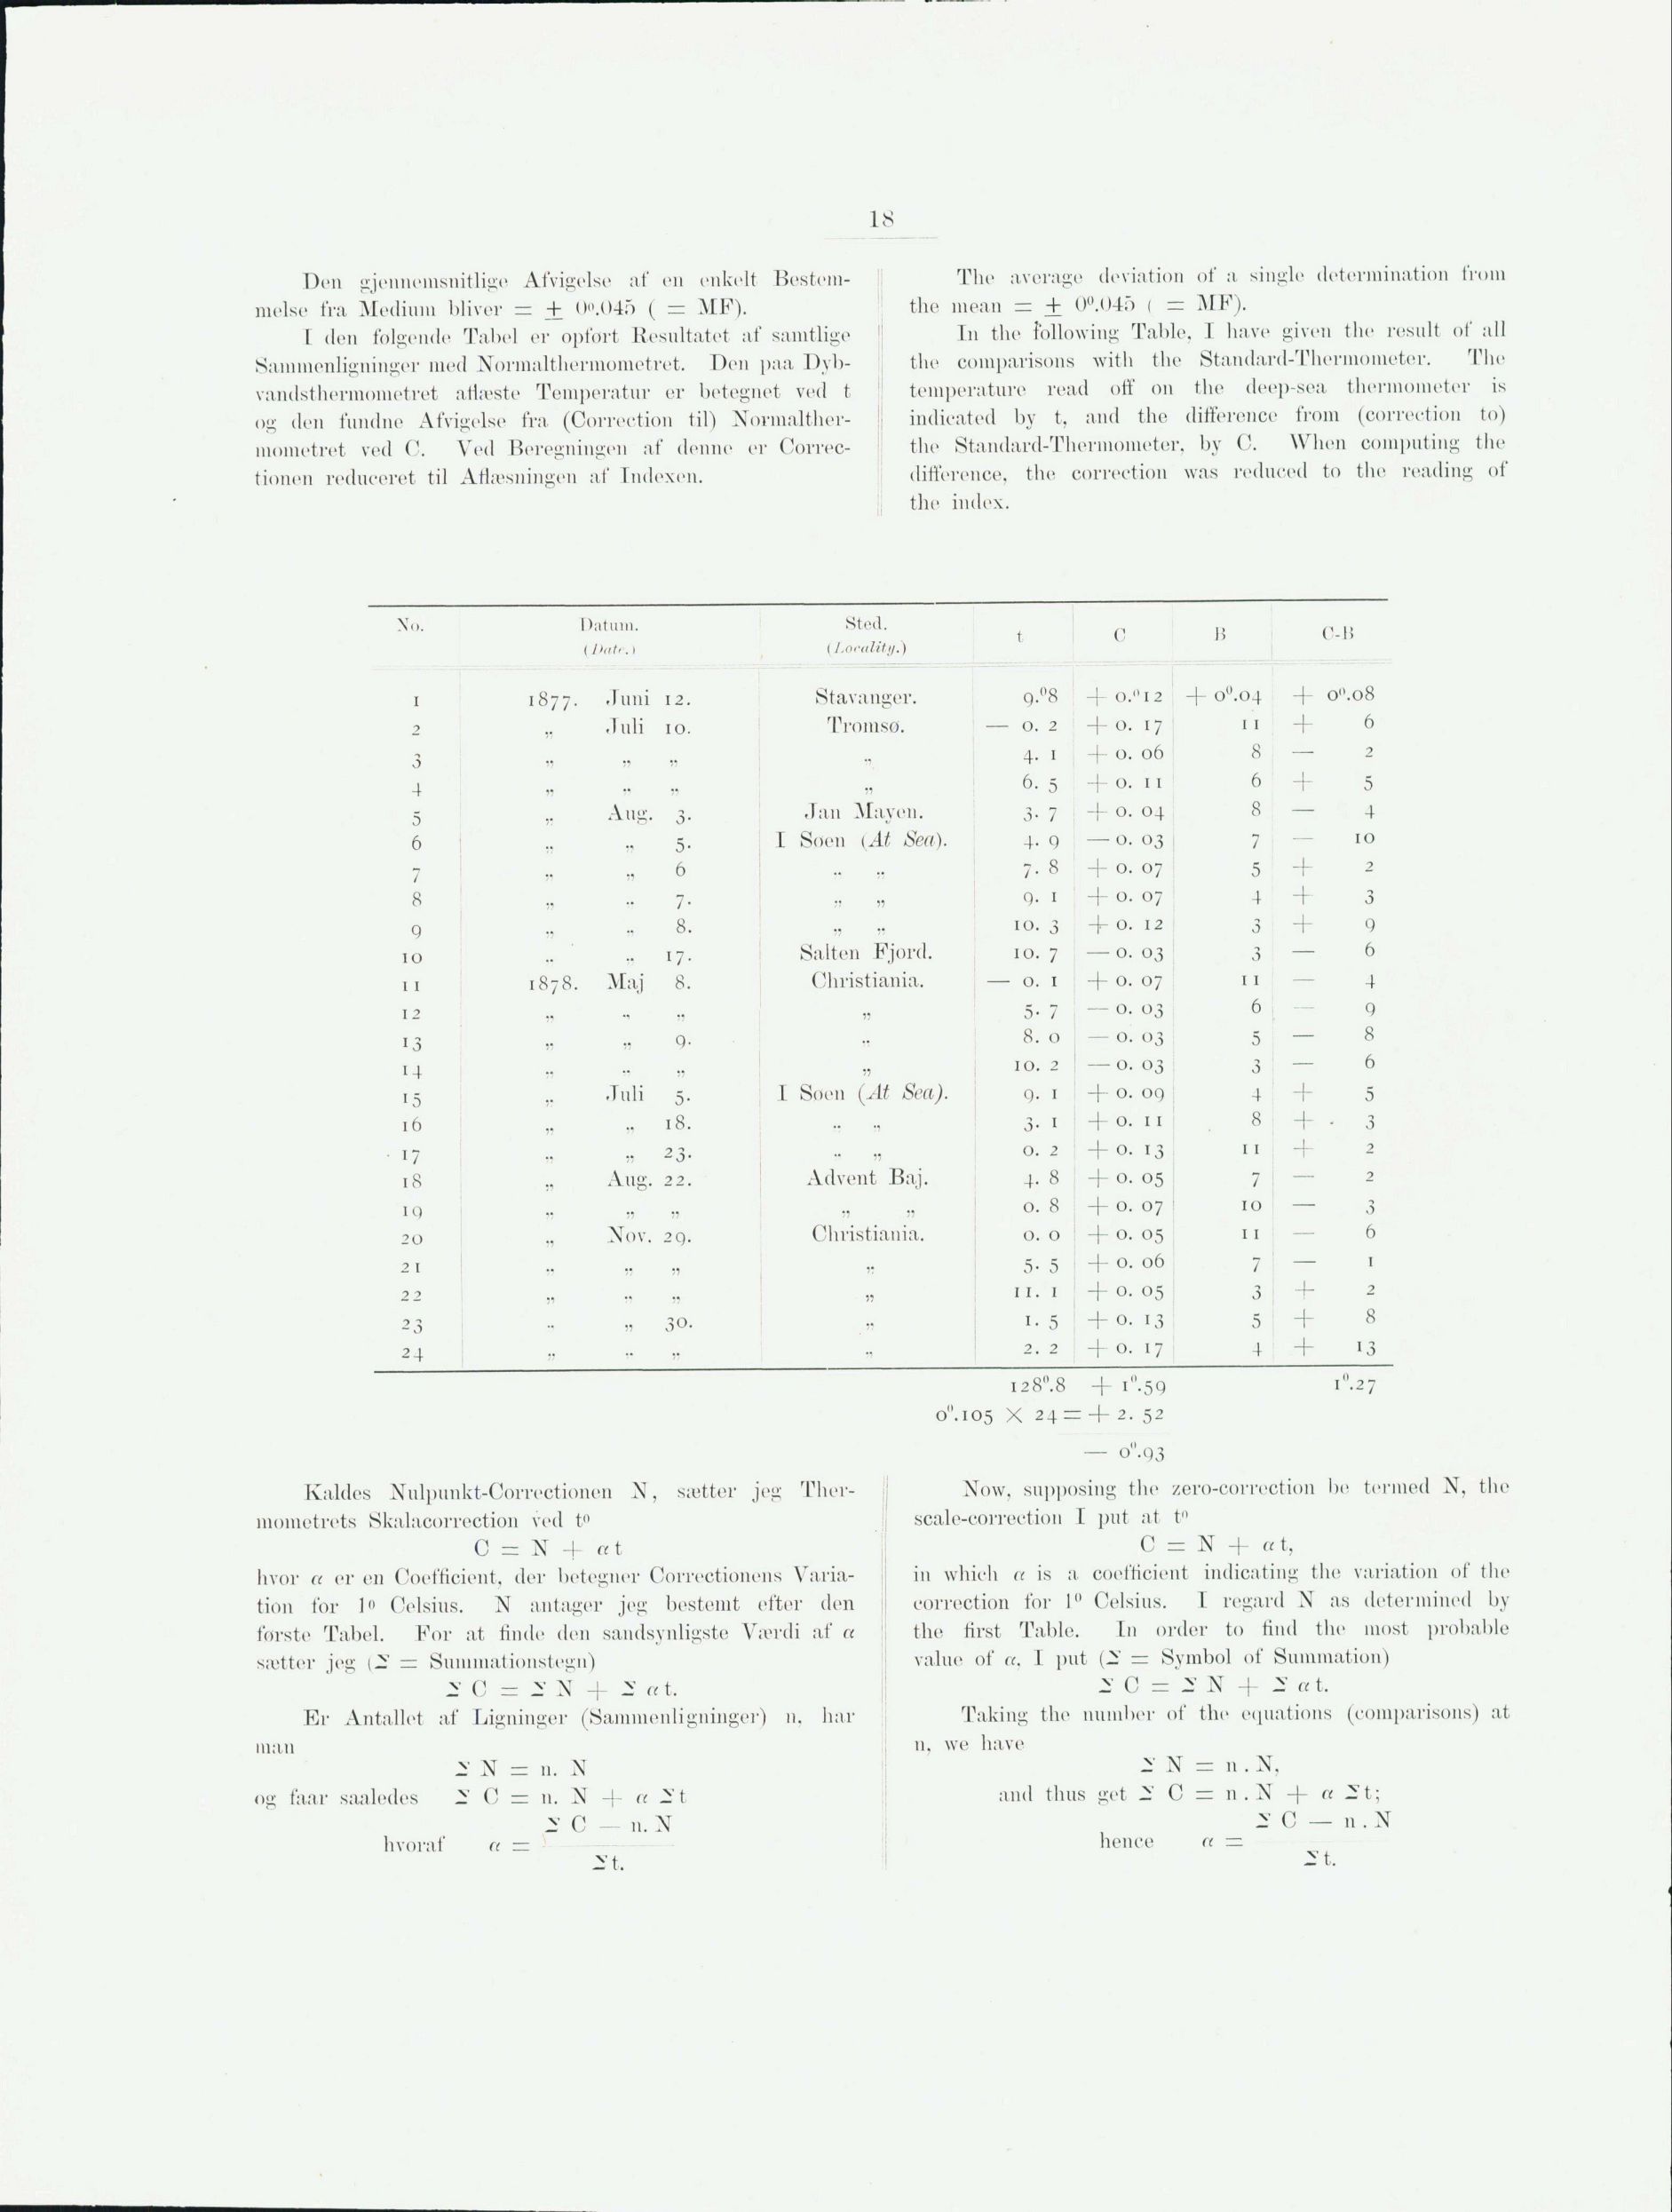
I den følgende Tabel er opfort Resultatet af samtlige
Sammenligninger med Normalthermometret. Den paa
Dyb-vandsthermometret aflæste Temperatur er betegnet ved t
og den fundne Afvigelse fra (Correction til)
Normalthermometret ved C. Ved Beregningen af denne er
Correc-tionen reduceret til Aflæsningen af Indexen.
The average deviation of a single determination from
the mean = + 0°.04ö i =r MF).
In the following Table, I have given the result of all
the comparisons with the Standard-Thermometer. The
temperature read off on the deep-sea thermometer is
indicated by t, and the difference from (correction to)
the Standard-Thermometer, by C. When computing the
difference, the correction was reduced to the reading of
the index.
No. Datura. Steil. ^ (>
(Date, i (Locality.)
1 1877. Juni 12. Stavanger. g.°8 j -|-o."i2 -f- o0.o4 o".o8
2 „ Juli 10. Tromsø. — o, 2 | +0. 17 ir 6
3 „ „ ., 4. i j —f- o. 06 8 — 2
4 „ ■• •,’ -.i 6. 5 + o. 11 6 + 5
5 ,. Aug. 3. Jan Maven. 3. 7 , -j- o. 04 8 — 4
6 .. ..5. I Soen (At Sea). 4. g —o. 03 7 10
7 .. „ 6 .. ., 7. 8 ’ + o. 07 5 + 2
8 „ .. 7. .. „ g. i 4- o. 07 4+3
g .. .. 8. ., 10. 3 +0.12 3+9
10 .. ..17. Salten Fjord. 10. 7 —o. 03 3 — 6
11 1878. Maj 8. Christiania. — o. 1 + o. 07 11 — 4
12 „ ,, „ 5. 7 — o. 03 6 g
13 ,, „g. .. 8. o — o. 03 5—8
14 .. „ ,, 10. 2 —o. 03 3 — 6
15 .. Juli 5. I Soen (At Sea). g. 1 + o. og 4 + 5
16 „ ..18. .... 3. i I + o. il 8 j +. 3
17 .. „ 23. .. ., o. 2 + o. 13 II + 2
i R „ Aug. 22. 1 Advent Baj. 4. 8 j + o. 05 7 — 2
i g „ ,, „ ,, „ o. 8 i + o. 07 ’ 10 — 3
20 Nov. 2g. Christiania. o. o ! + o. 05 11 — 6
21 ,, „ ,, 5. 5 + o. 06 7 — i
22 „ „ „ il. i +0.05 3 "f~ 2
23 •■ » 30. „ 1.5 +0.13 5 + 8
24 .. .. .. .. 2. 2 -f o. 17 4 + 13
12 8". 8 -f i ".50 i2 7
o". 105 X 24 = + 2. 52
— o".g3
Kaldes Nulpunkt-Correctionen N, sætter jeg
Thermometrets Skalacorrection ved t°
C = N + «t
hvor « er en Coefficient, der betegner Correctionens
Variation for 1° Celsius. N antager jeg bestemt efter den
første Tabel. For at finde den sandsynligste Værdi af «
sætter jeg — Sumniationstegn)
i’ C = i N + i «t.
Er Antallet af Ligninger (Sammenligninger) 11. har
man
2 N = il. N
og faar saaledes i C =z 11. N + rc - t
n. N
hvoraf a =
Now. supposing the zero-correction be termed N, the
scale-correction I put at t°
C = N + ,<t,
in which ei is a coefficient indicating the variation of the
correction for 1" Celsius. I regard N as determined by
the first Table. In order to find the most probable
value of a. I put (i’ = Symbol of Summation)
C = N -f i a t.
Taking the number of the equations (comparisons) at
11. we have
i’ N = n . N,
and thus get C = n.N -)- «it;
i C — 11. N
hence a =
<< prev. page << föreg. sida << >> nästa sida >> next page >>