
Full resolution (JPEG) - On this page / på denna sida - Population, by G. Amnéus
<< prev. page << föreg. sida << >> nästa sida >> next page >>
Below is the raw OCR text
from the above scanned image.
Do you see an error? Proofread the page now!
Här nedan syns maskintolkade texten från faksimilbilden ovan.
Ser du något fel? Korrekturläs sidan nu!
This page has been proofread at least once.
(diff)
(history)
Denna sida har korrekturlästs minst en gång.
(skillnad)
(historik)
are divided in the proportion of 1206 women to 1000 men. The
large excess of women in the towns is due in a great measure to
the influx of domestic servants.
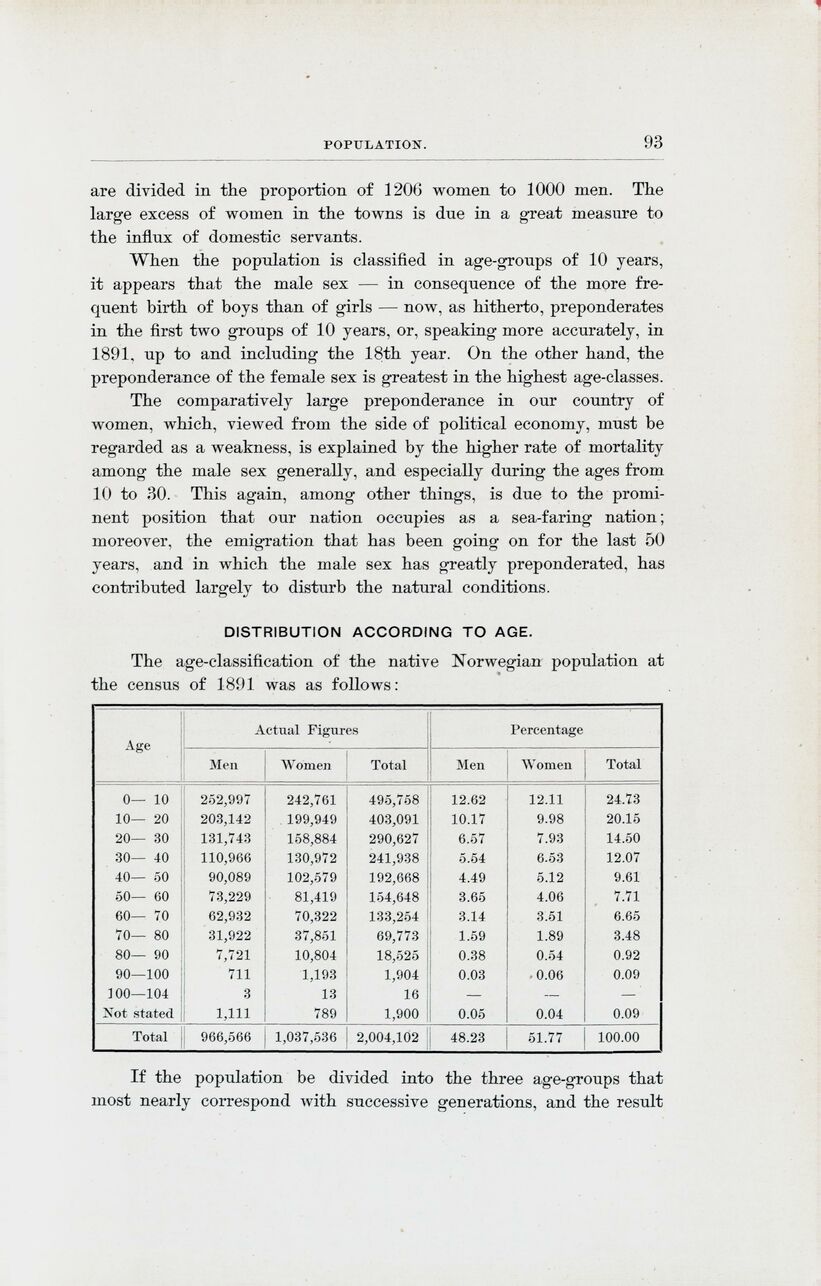
When the population is classified in age-groups of 10 years,
it appears that the male sex — in consequence of the more
frequent birth of boys than of girls — now, as hitherto, preponderates
in the first two groups of 10 years, or, speaking more accurately, in
1891, up to and including the 18th year. On the other hand, the
preponderance of the female sex is greatest in the highest age-classes.
The comparatively large preponderance in our country of
women, which, viewed from the side of political economy, must be
regarded as a weakness, is explained by the higher rate of mortality
among the male sex generally, and especially during the ages from
10 to 30. This again, among other things, is due to the
prominent position that our nation occupies as a sea-faring nation;
moreover, the emigration that has been going on for the last 50
years, and in which the male sex has greatly preponderated, has
contributed largely to disturb the natural conditions.
| Age | Actual Figures | Percentage | ||||
| Men | Women | Total | Men | Women | Total | |
| 0— 10 | 252,997 | 242,7151 | 495,758 | 12.62 | 12.11 | 24.73 |
| 10— 20 | 203,142 | 199,949 | 403,091 | 10.17 | 9.98 | 20.15 |
| 20— 30 | 131,743 | 158,8S4 | 290,627 | 6.57 | 7.93 | 14.50 |
| 30— 40 | 110,966 | 130,972 | 241,938 | 5.54 | 6.53 | 12.07 |
| 40— 50 | 90,089 | 102,579 | 192,668 | 4.49 | 5.12 | 9.61 |
| 50— 60 | 73,229 | 81,419 | 154,648 | 3.65 | 4.06 | 7.71 |
| 60— 70 | 62,932 | 70,322 | 133,254 | 3.14 | 3.51 | 6.65 |
| 70— 80 | 31,922 | 37,851 | 69,773 | 1.59 | 1.89 | 3.48 |
| 80— 90 | 7,721 | 10,804 | 18,525 | 0.38 | 0.54 | 0.92 |
| 90—100 | 711 | 1,193 | 1,904 | 0.03 | 0.06 | 0.09 |
| 100—104 | 3 | 13 | 16 | — | — | — |
| Not stated | 1,111 | 789 | 1,900 | 0.05 | 0.04 | 0.09
|
| Total | 966,566 | 1,037,536 | 2,004,102 | 48.23 | 51.77 | 100.00 |
<< prev. page << föreg. sida << >> nästa sida >> next page >>