
Full resolution (JPEG) - On this page / på denna sida - Bilagor - Diagram
<< prev. page << föreg. sida << >> nästa sida >> next page >>
Below is the raw OCR text
from the above scanned image.
Do you see an error? Proofread the page now!
Här nedan syns maskintolkade texten från faksimilbilden ovan.
Ser du något fel? Korrekturläs sidan nu!
This page has never been proofread. / Denna sida har aldrig korrekturlästs.
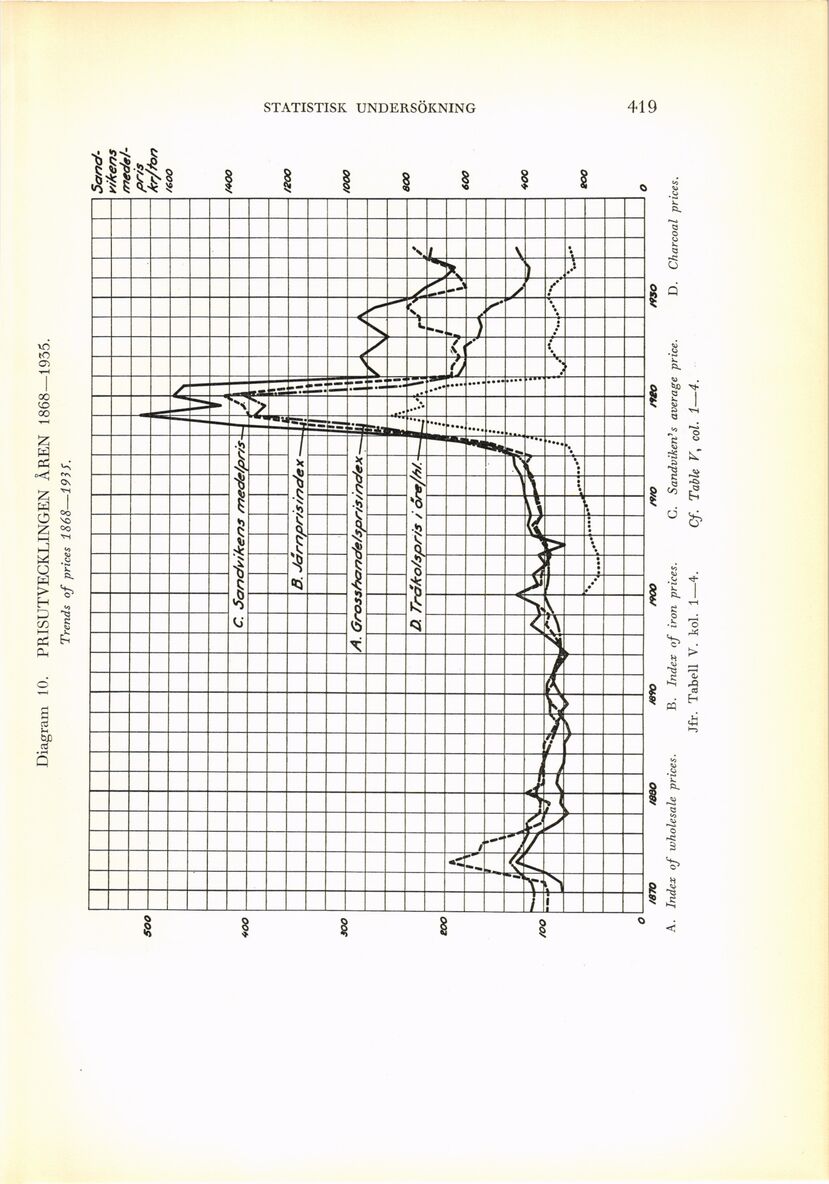
Diagram 10. PRISUTVECKLINGEN ÅREN 1868—1935.
Trends of prices 1868—193 S.
/sto /aao
A. Index of wholesale prices.
/890 /900
B. Index of iron prices.
Jfr. Tabell V. kol. 1—4.
n/o neo
C. Sandviken^s average price.
Cf. Tàble V, col. 1—4.
mo
D. Charcoal prices.
<< prev. page << föreg. sida << >> nästa sida >> next page >>