
Full resolution (JPEG) - On this page / på denna sida - II. The Swedish People - 2. Demography. By [G. Sundbärg] E. Arosenius

<< prev. page << föreg. sida << >> nästa sida >> next page >>
Below is the raw OCR text
from the above scanned image.
Do you see an error? Proofread the page now!
Här nedan syns maskintolkade texten från faksimilbilden ovan.
Ser du något fel? Korrekturläs sidan nu!
This page has never been proofread. / Denna sida har aldrig korrekturlästs.
division of the population according to age. 125
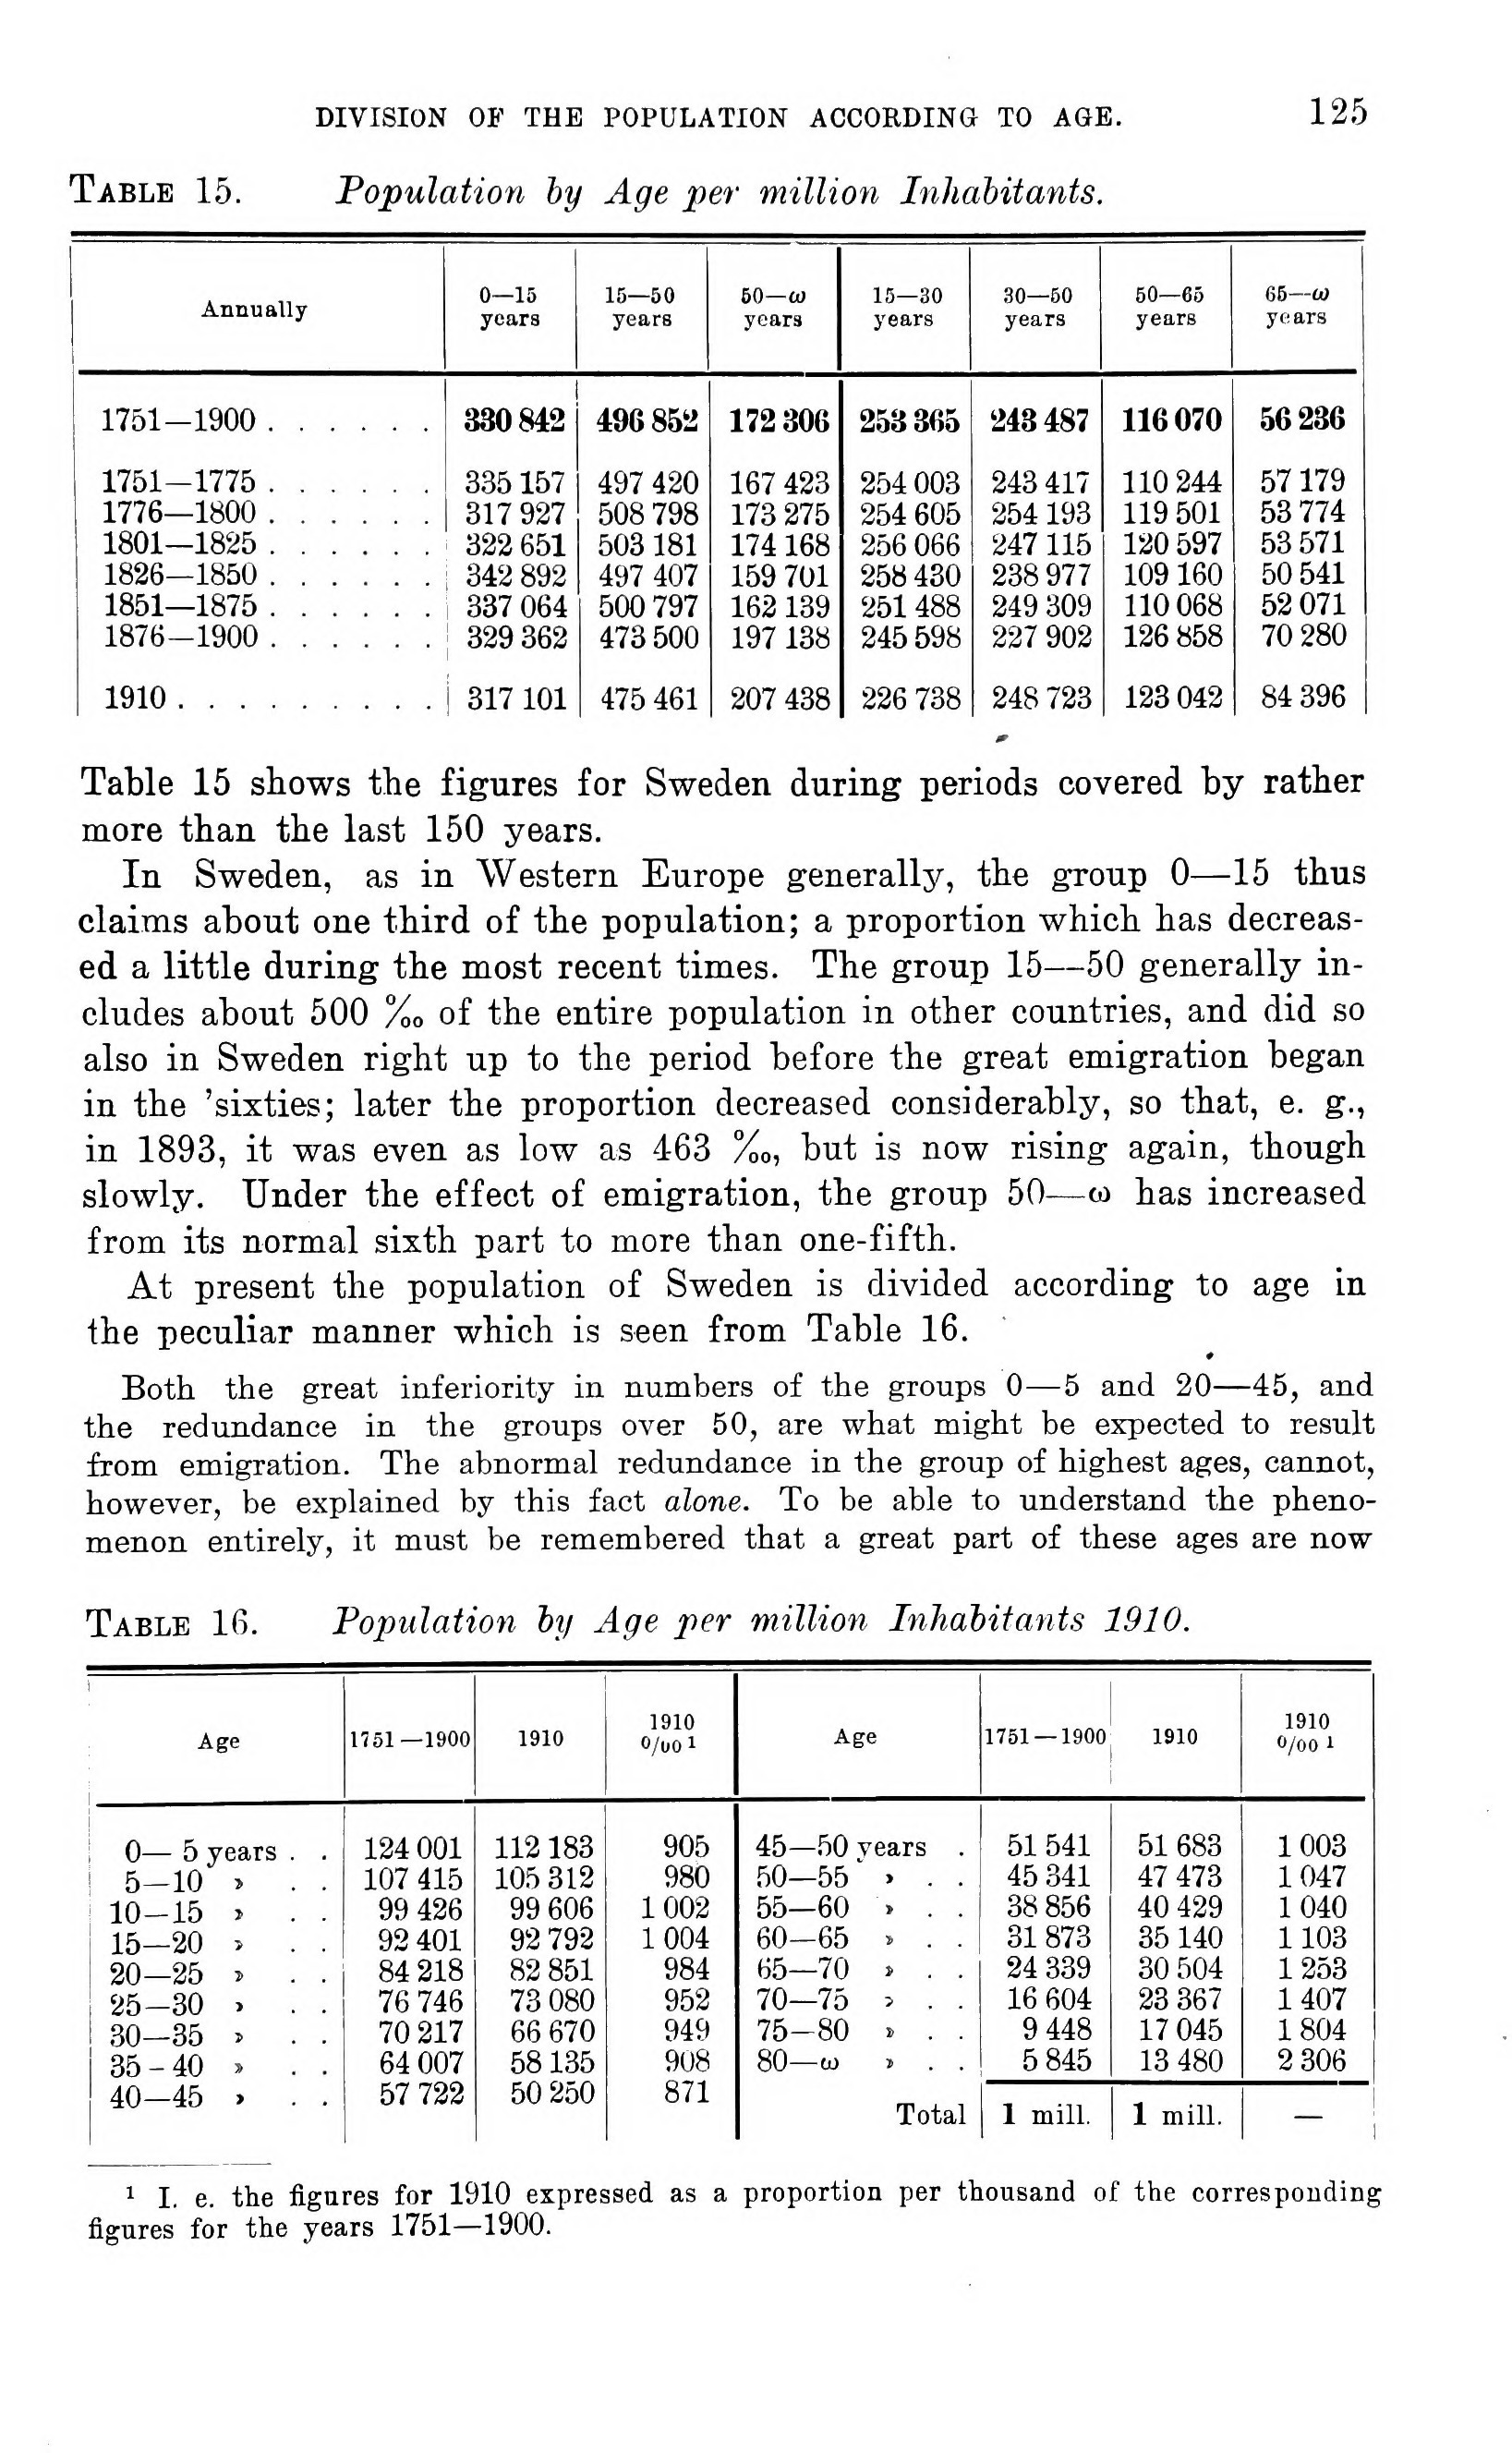
Table 15. Population by Age per million Inhabitants.
Annually 0—15 years 15—50 years 50—CO years 15—30 years 30—50 years 50—05 years 65—Ul years
1751-1900 ...... 330842 496 852 172 306 253365 243 487 116070 56236
1751-1775 ...... 335 157 497 420 167 423 254 003 243 417 110 244 57 179
1776—1800 ...... 317 927 508 798 173 275 254 605 254 193 119 501 53 774
1801—1825 ...... 322 651 503 181 174 168 256 066 247 115 120 597 53 571
1826—1850 ...... 342 892 497 407 159 701 258 430 238 977 109 160 50 541
1851—1875 ...... 337 064 500 797 162 139 251488 249 309 110 068 52 071
1876-1900 ...... 329 362 473 500 197 138 245 598 227 902 126 858 70 280
1910......... 317 101 475 461 207 438 226 738 248 723 123 042 84 396
Table 15 shows the figures for Sweden during periods covered by rather
more than the last 150 years.
In Sweden, as in Western Europe generally, the group 0—15 thus
claims about one third of the population; a proportion which has
decreased a little during the most recent times. The group 15—50 generally
includes about 500 %0 of the entire population in other countries, and did so
also in Sweden right up to the period before the great emigration began
in the ’sixties; later the proportion decreased considerably, so that, e. g.,
in 1893, it was even as low as 463 %0, but is now rising again, though
slowly. Under the effect of emigration, the group 50—w has increased
from its normal sixth part to more than one-fifth.
At present the population of Sweden is divided according to age in
the peculiar manner which is seen from Table 16.
Both the great inferiority in numbers of the groups 0—5 and 20—45, and
the redundance in the groups over 50, are what might be expected to result
from emigration. The abnormal redundance in the group of highest ages, cannot,
however, be explained by this fact alone. To be able to understand the
phenomenon entirely, it must be remembered that a great part of these ages are now
Table 16. Population by Age per million Inhabitants 1910.
Age 1751—1900 1910 1910 o/uo l
0— 5 years . . 124 001 112 183 905
5-10 > . . 107 415 105 312 980
10-15 > . . 99 426 99 606 1002
15—20 > . . 92 401 92 792 1004
20—25 > . . 84 218 82 851 984
25-30 > . . 76 746 73 080 952
30—35 » . . 70 217 66 670 949
j 35-40 » . . 64 007 58135 908
1 40-45 » . . 57 722 50 250 871
45-50 vears . 51541 51683 1003
50—55 > . . 45 341 47 473 1047
55-60 . . . 38 856 40 429 1040
60-65 » . . 31 873 35 140 1103
65—70 » . . 24 339 30 504 1253
70—75 = . . 16 604 23 367 1407
75-80 » . . 9 448 17 045 1804
80—to > . . 5 845 13 480 2 306
Total I 1 mill. 1 mill. —
1 I. e. the figures for 1910 expressed as a proportion per thousand of the corresponding
figures for the years 1751—1900.
<< prev. page << föreg. sida << >> nästa sida >> next page >>