
Full resolution (JPEG) - On this page / på denna sida - II. The Swedish People - 2. Demography. By [G. Sundbärg] E. Arosenius

<< prev. page << föreg. sida << >> nästa sida >> next page >>
Below is the raw OCR text
from the above scanned image.
Do you see an error? Proofread the page now!
Här nedan syns maskintolkade texten från faksimilbilden ovan.
Ser du något fel? Korrekturläs sidan nu!
This page has never been proofread. / Denna sida har aldrig korrekturlästs.
lif)
II. THE SWEDISH PEOPLE.
Sweden took the lead in the matter of a low death-rate, but it has since
lost some ground to Norway, and, on the whole, to Denmark.
During the ten years 1901—10 the total average death-rate per thousand
amounted to the following among various countries: for Sweden, 14’9; Norway,
14’2; Denmark, 14-2; England, 15’4; Scotland, 16’6; Netherlands, 15"i; Belgium,
16’4; Switzerland, 16’7; Finland, 18’o; France, 19’i; the German Empire, 18-7;
Italy, 21’s; Western Austria, 22-2; Servia, 23’3; Galicia-Bukovina, 26’0; Hungary,
25’7; Russia, 31"o.
Table 26 gives a comparison, covering certain years, between the
mortality at certain ages in Sweden, on the one hand, and, on the other, in
the whole of Western Europe, in England, and in France. It is very
evident that Sweden’s position is extraordinarily favourable during the
early years of life, but not, by any means, in these alone. In the group
0—5 years, the mortality in Sweden is 41 % lower than in Western
Europe, 34 °/o lower than in France, and 31 % lower than in England.
If we regard the first year of life alone, the difference is generally still
more favourable to Sweden.
The position is, on the other hand, less favourable for the age-group
5—15, and especially for the period 5—10 years, the time when infectious
children’s diseases are rife, and which thus forms "the Achilles-heel" of
the poorer and less populous countries. The richer and more populous
countries here easily win an advantage, by means of their greater
resources as regards the necessary medical aid.
The mortality in Sweden in every dt/e-group bettveen the years 15—75
is about 25 % lower than in Western Europe in general.
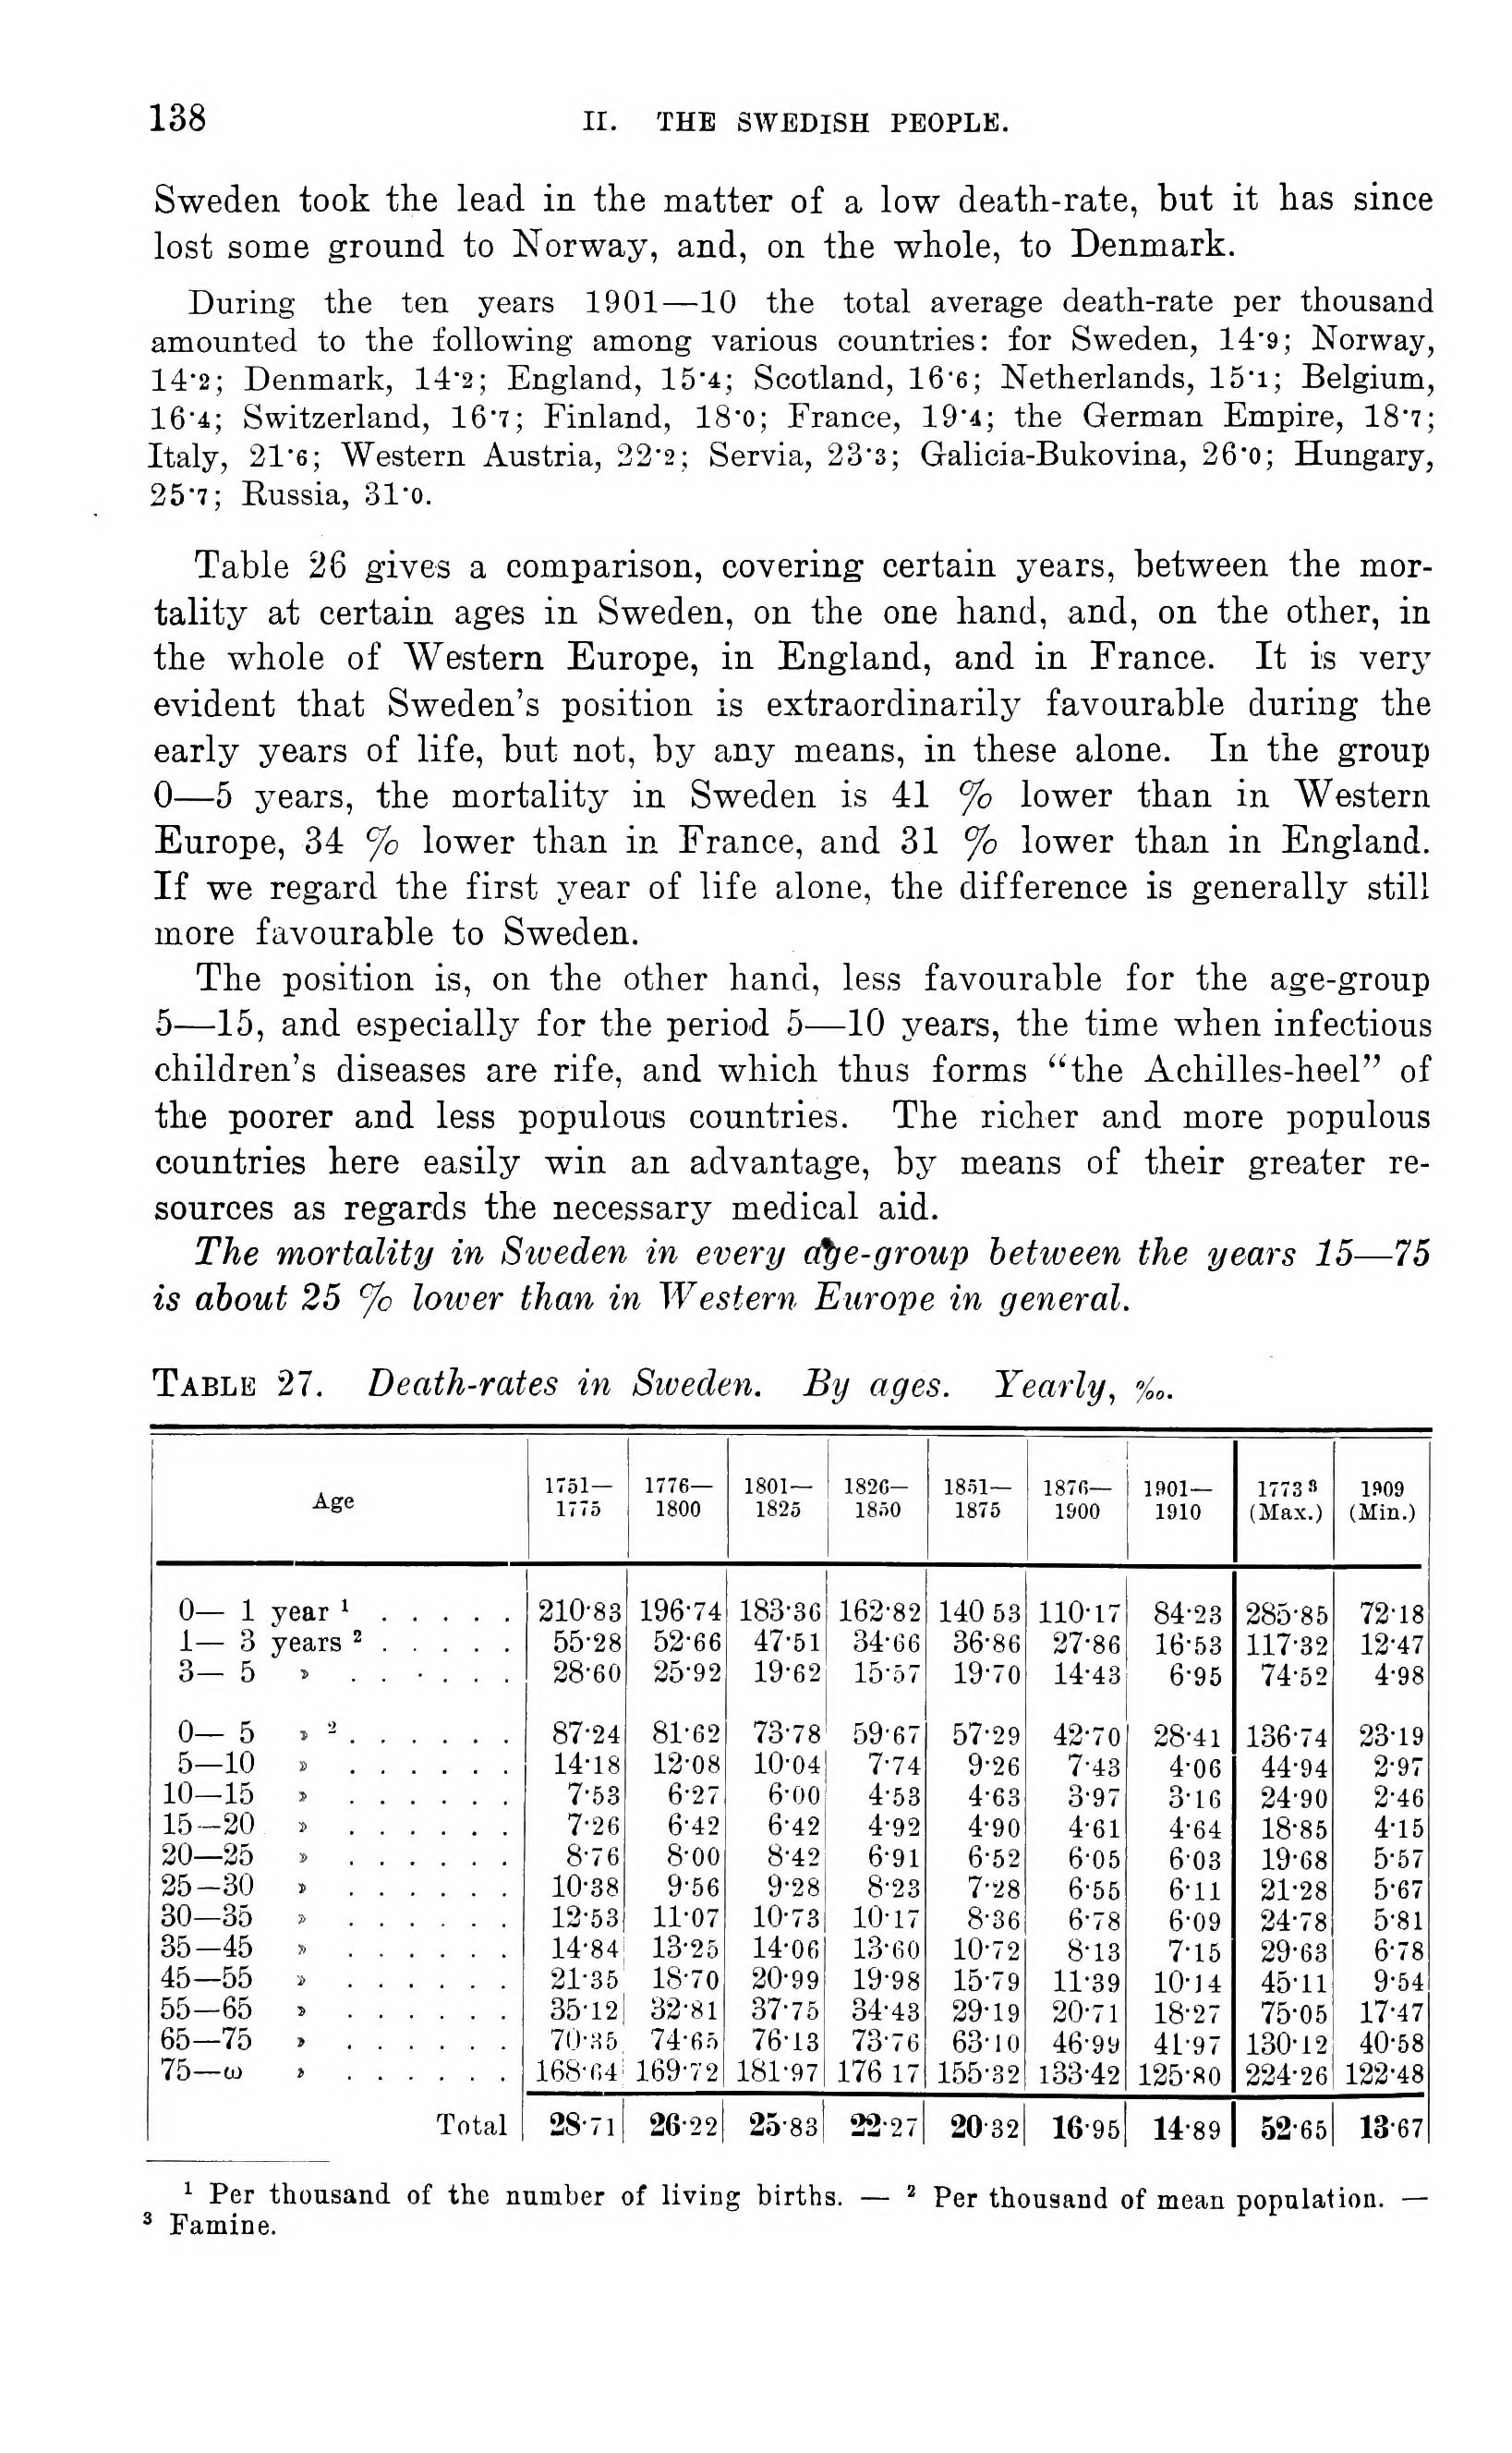
Table 27. Death-rates in Sweden. By ages. Yearly, %„.
Age 1751— 1715 1776— 1800 1801— 1825 [-1820-1850-] {+1820- 1850+} 1851— 1875 1870— 1500 1901— 1910 1773 » (Max.) 1909 (Min.)
0— 1 year 1..... 210-83 196-74 183-36 162-82 140 53 110-17 84-23 285-85 72-18
1— 3 years 2..... 55-28 52-66 47-51 34-66 36-86 27-86 16-53 117-32 12-47
3—5 » ...... 28-60 25-92 19-62 15-57 19-70 14-43 6-95 74-52 4-98
0—5 » 2...... 87-24 81-62 73-78 59-67 57-29 42-70 28-41 136-74 23-19
5—10 . ...... 14-18 12-08 10-04 7-74 9-26 7-43 4-06 44-94 2-97
10—15 » ...... 7-53 6-27 6-00 4-53 4-63 3-97 3-16 24-90 2-46
15—20 » ...... 7’26 6-42 6-42 4-92 4-90 4-61 4-64 18-85 4-15
20—25 » ...... 8-76 8-00 8-42 6-91 6-52 6-05 6-03 19-68 5-57
25-30 . ...... 10-38 9-56 9-28 8-23 7-28 6-55 6-11 21-28 5-67
30—35 » ...... 12-53 11-07 10-73 10-17 8-36 6-78 6-09 24-78 5-81
35-45 » ...... 14-84 13-25 14-06 13-60 10-72 8-13 7-15 29-63 6-78
45—55 * ...... 21-35 18-70 20-99 19-98 15-79 11-39 10-14 45-11 9-54
55-65 > ...... 35-12 32-81 37-75 34-43 29-19 20-71 18-27 75-05 17-47
65-75 » ...... 70-M5 74-65 76-13 73-76 63-10 46-99 41-97 130-12 40-58
75—w » ...... 168-64 169-72 181-97 176 17 155-32 133-42 125-80 224-26 122-48
Total 28-71 20-22 25-83 22-27 20-32 16-95 14-89 52-65 13-67
1 Per thousand, of the number of living births. — 1 Per thousand of mean population. —
3 Famine.
<< prev. page << föreg. sida << >> nästa sida >> next page >>