
Full resolution (JPEG) - On this page / på denna sida - VI. Mining and Metallurgical Industry. General Survey. By C. Sahlin - 2. Iron and Steel Industry. By J. A. Leffler
<< prev. page << föreg. sida << >> nästa sida >> next page >>
Below is the raw OCR text
from the above scanned image.
Do you see an error? Proofread the page now!
Här nedan syns maskintolkade texten från faksimilbilden ovan.
Ser du något fel? Korrekturläs sidan nu!
This page has never been proofread. / Denna sida har aldrig korrekturlästs.
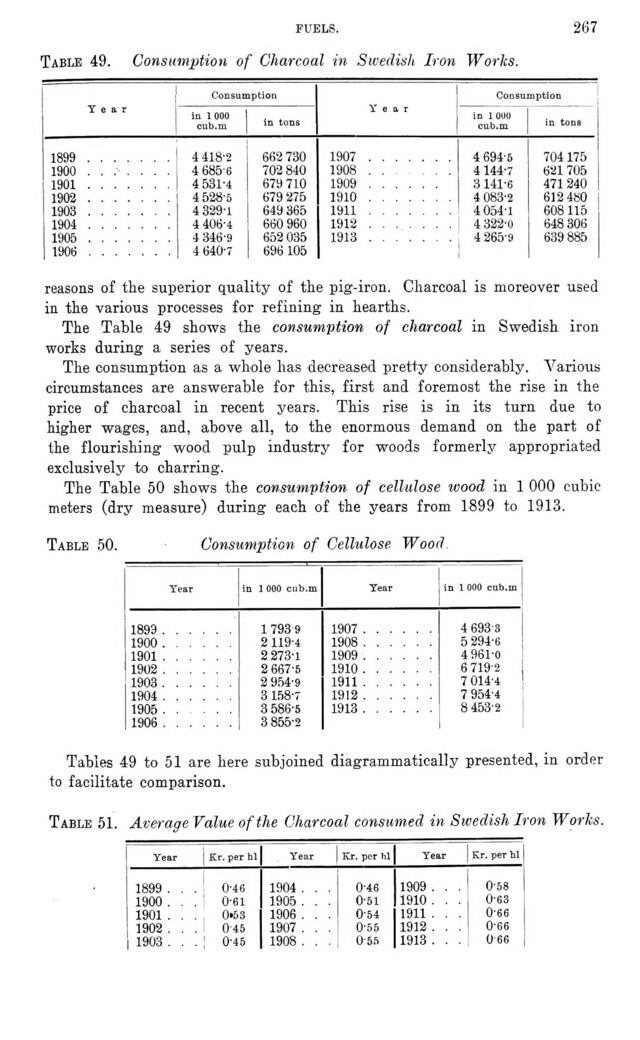
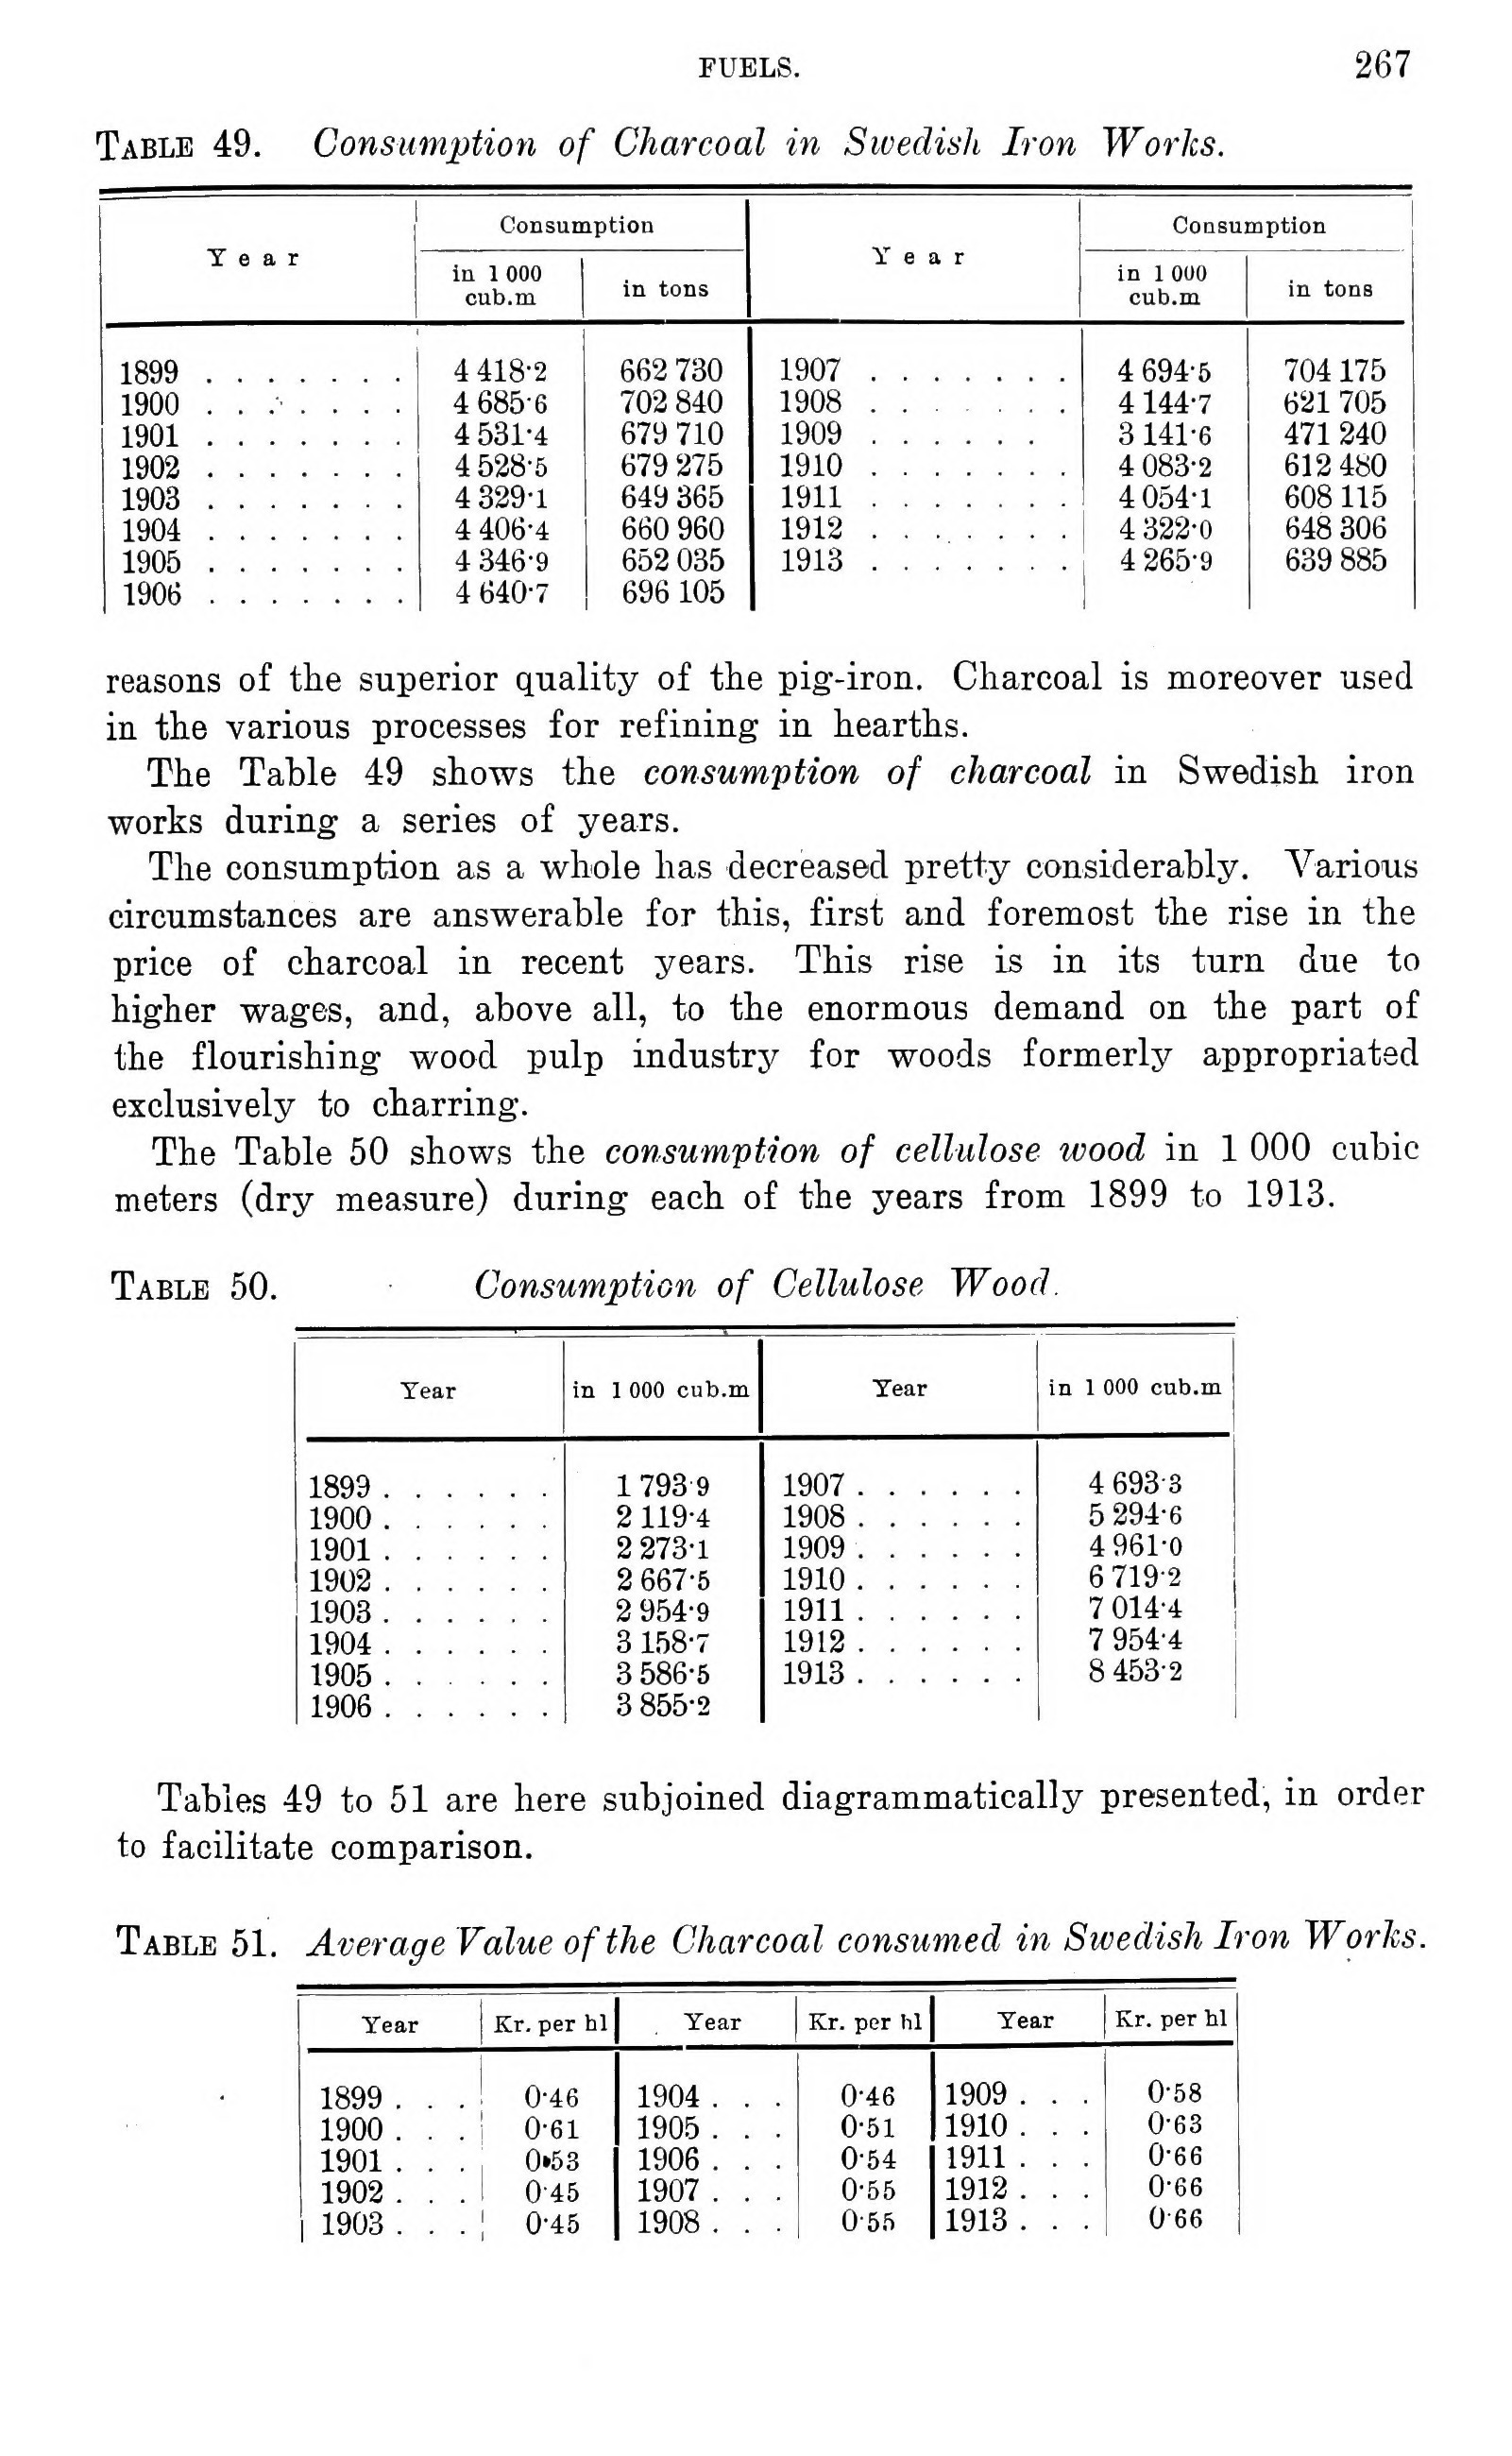
fuels. 267
Table 49. Consumption of Charcoal in Swedish Iron Works.
Year Consumption
in 1 000 cub.m in tons
1899 ....... 4 418-2 662 730
1900 ....... 4 685-6 702 840
1901....... 4 531-4 679 710
1902 ....... 4 528-5 679 275
1903 ....... 4 329-1 649 365
1904 ....... 4 406-4 660 960
1905 ....... 4 346-9 652 035
1906 ....... 4 640-7 696 105
1907 ..............4 694-5 704175
1908 . . . . 4144-7 621705
1909 ............3 141-6 471 240
1910 ..............4 083-2 612 480
1911 ..............4 054-1 608115
1912 ..............4 322-0 648 306
1913 ..............4 265-9 639 885
reasons of the superior quality of the pig’-iron. Charcoal is moreover used
in the various processes for refining in hearths.
The Table 49 shows the consumption of charcoal in Swedish iron
works during a series of years.
The consumption as a whole has decreased pretty considerably. Various
circumstances are answerable for this, first and foremost the rise in the
price of charcoal in recent years. This rise is in its turn due to
higher wages, and, above all, to the enormous demand on the part of
the flourishing wood pulp industry for woods formerly appropriated
exclusively to charring.
The Table 50 shows the consumption of cellulose ivood in 1 000 cubic
meters (dry measure) during each of the years from 1899 to 1913.
Table 50. Consumption of Cellulose Wood.
Year in 1 000 cub.m
1899 ...... 1 793 9
1900 ...... 2119-4
1901...... 2 273-1
1902 ...... 2 667-5
1903 ...... 2 954-9
1904 ...... 3 158-7
1905 ...... 3 586-5
1906 ...... 3 855-2
1907 ............4 693-8
1908 ............5 294-6
1909 ............4 961-0
191 0............6 7192
191 1............7 014-4
1912 ............7 954-4
1913 ............8 453-2
I
Tables 49 to 51 are here subjoined diagrammatically presented, in order
to facilitate comparison.
Table 51. Average Value of the Charcoal consumed in Sivedish Iron Works.
Year Kr. per bl
1899 . . . 0-46
1900 . . . 0-61
1901 . . . 0«53
1902 . . . 0-45
1903 . . . 0-45
1904 . . . 0-46
1905 ... 0-51
1906 . . . 0-54
1907 . . . 0-55
1908 . . . 0-55
1909 . . . 0-58
1910 . . . 0-63
1911 . . . 0-66
1912 . . . 0-66
1913 . . . 0 66
<< prev. page << föreg. sida << >> nästa sida >> next page >>