
Full resolution (JPEG) - On this page / på denna sida - VII. Manufacturing Industries. Introd. by [G. Sundbärg] K. Åmark
<< prev. page << föreg. sida << >> nästa sida >> next page >>
Below is the raw OCR text
from the above scanned image.
Do you see an error? Proofread the page now!
Här nedan syns maskintolkade texten från faksimilbilden ovan.
Ser du något fel? Korrekturläs sidan nu!
This page has never been proofread. / Denna sida har aldrig korrekturlästs.
ft
318 vii. manufacturing industries.
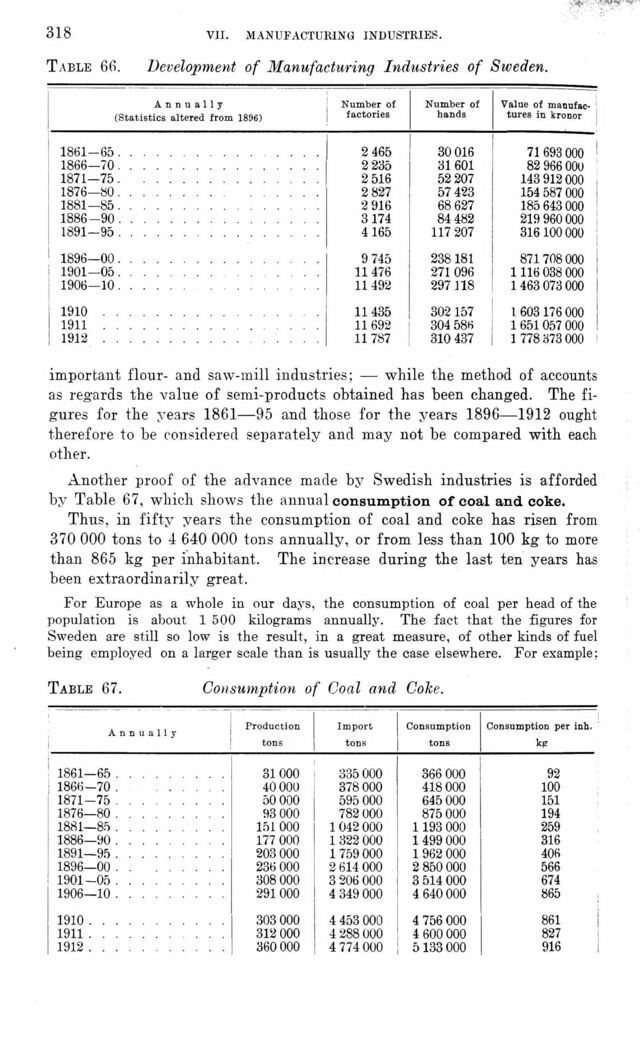
Table 66. Development of Manufacturing Industries of Sweden.
Annually (Statistics altered from 1896) Number of factories Number of hands Value of
manufactures in kronor
1861-65................ 2 465 30 016 71 693 000
1866-70................ 2 235 31 601 82 966 000
1871-75............... 2 516 52 207 143 912000
1876—SO............... 2 827 57 423 154 587 000
1881—85................ 2 916 68 627 185 643 000
1886-90 ................ 3174 84 482 219 960 000
1891—95 ................ 4165 117 207 316 100 000
1896—00................ 9 745 238 181 871 708 000
1901—05............... 11476 271 096 1 116 038 000
1906-10............... 11492 297 118 1 463 073 000
1910............... 11435 302 157 1 603 176 000
1911............. 11692 304 586 1 651057 000
1912................. 11 787 310 437 1 778 373 000
important flour- and saw-mill industries; — while the method of accounts
as regards the value of semi-products obtained has been changed. The
figures for the years 1861—95 and those for the years 1896—1912 ought
therefore to be considered separately and may not be compared with each
other.
Another proof of the advance made by Swedish industries is afforded
by Table 67, which shows the annual consumption of coal and coke.
Thus, in fifty years the consumption of coal and coke has risen from
370 000 tons to 4 640 000 tons annually, or from less than 100 kg to more
than 865 kg per inhabitant. The increase during the last ten years has
been extraordinarily great.
For Europe as a whole in our days, the consumption of coal per head of the
population is about 1 500 kilograms annually. The fact that the figures for
Sweden are still so low is the result, in a great measure, of other kinds of fuel
being employed on a larger scale than is usually the case elsewhere. For example;
Table 67. Consumption of Coal and Colce.
Annually Production tons Import tons Consumption tons Consumption per inh. kg
1861-65 ......... 31 000 335 000 366 000 92
1866-70 ...... 40 000 378 000 418 000 100
1871-75 ........ 50 000 595 000 645 000 151
1876—80 ......... 93 000 782 000 875 000 194
1881 85 ......... 151 000 1 042 000 1 193 000 259
1886—90 ......... 177 000 1 322 000 1 499 000 316
1891—95 ......... 203 000 1 759 000 1 962 000 406
1896—00 ........ 236 000 2 614 000 2 850 000 566
1901-05 ......... 308 000 3 206 000 3 514 000 674
1906—10 ......... 291 000 4 349 000 4 640 000 865
1910........... 303 000 4 453 000 4 756 000 861
1911.......... 312 000 4 288 000 4 600 000 827
1912........... 360 000 4 774 000 5133 000 916
<< prev. page << föreg. sida << >> nästa sida >> next page >>