
Full resolution (JPEG) - On this page / på denna sida - Part I - Doctor Kaarlo Hildén, Helsingfors, Some Anthropological Data on the Inhabitants of Swedish and Finnish Extraction in Finland

<< prev. page << föreg. sida << >> nästa sida >> next page >>
Below is the raw OCR text
from the above scanned image.
Do you see an error? Proofread the page now!
Här nedan syns maskintolkade texten från faksimilbilden ovan.
Ser du något fel? Korrekturläs sidan nu!
This page has never been proofread. / Denna sida har aldrig korrekturlästs.
time these two races have become mixed in a rather high degree, especially on
the mainland in the south of Finland. Meantime Westerlund has shown that in
spite of this, one can still prove that there are evident differences between the
Swedish and the Finnish inhabitants in Finland. In the same way, grounded
upon his anthropological researches he has been able to verify that there are
natural race*groups within the Finnish population. West Finns (in Finland pro*
per, Satakunta, and south Osterbotton), Tavastians (in the central parts of the
country), Karelians (in the eastern parts), Kävnerians (in north Osterbotton).
In doing this he has based his observations principally upon the following cha*
racteristics: the height, shape of head, and the colour of the eyes and hair.
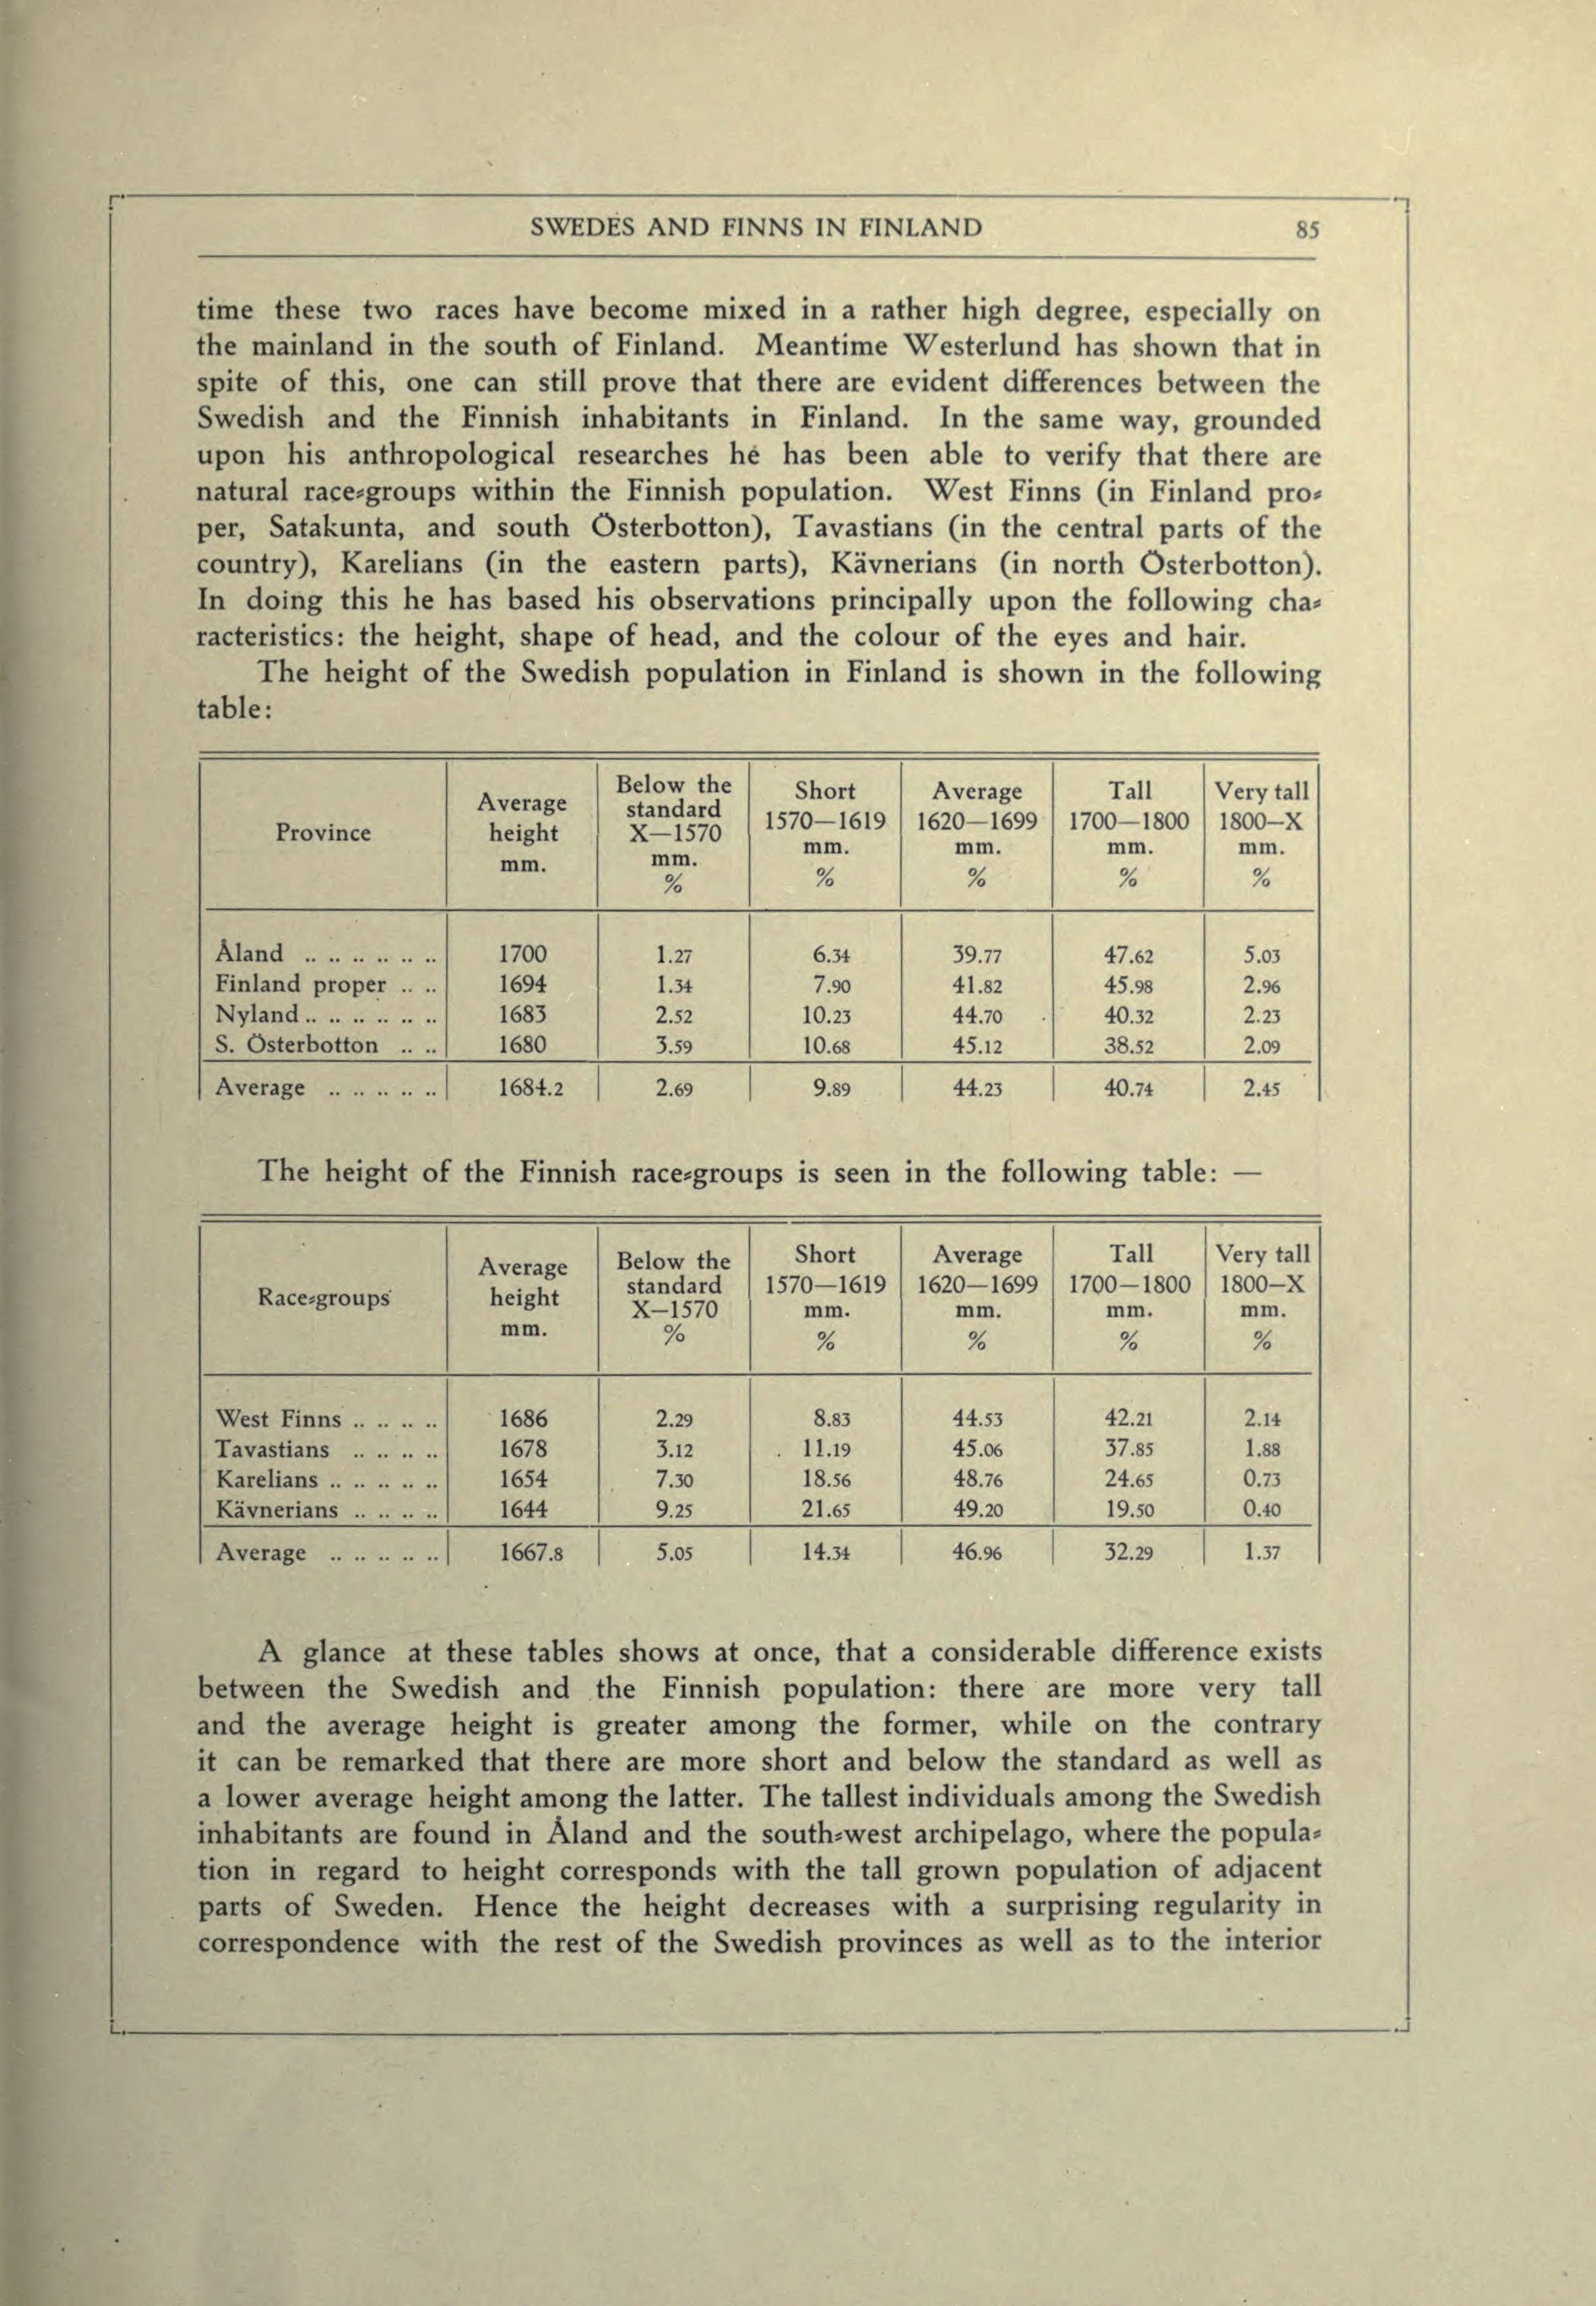
The height of the Swedish population in Finland is shown in the following
table:
Province Average height mm. Below the standard X—1570 mm. % Short 1570-1619 mm. % Average 1620-1699 mm. % Tall 1700-1800 mm. % Very tall 1800—X mm. %
Åland 1700 1.27 6.34 39.77 47.62 5.03
Finland proper .. .. 1694 1.34 7.90 41.82 45.98 2.%
Nyland 1683 2.52 10.23 44.70 40.32 2.23
S. Osterbotton .. .. 1680 3.59 10.68 45.12 38.52 2.09
Average 1684.2 2.69 9.89 44.23 40.74 2.45
The height of the Finnish race*groups is seen in the following table: —
Racesgroups Average height mm. Below the standard X—1570 % Short 1570—1619 mm. % Average 1620-1699 mm. % Tall 1700-1800 mm. % Very tall 1800—X mm. %
West Finns 1686 2.29 8.83 44.53 42.21 2.14
Tavastians 1678 3.12 . 11.19 45.06 37.85 1.88
Karelians 1654 7.30 18.56 48.76 24.65 0.73
Kävnerians 1644 9.25 21.65 49.20 19.50 0.40
Average 1667.8 5.05 14.34 46.% 32.29 1.37
A glance at these tables shows at once, that a considerable difference exists
between the Swedish and the Finnish population: there are more very tall
and the average height is greater among the former, while on the contrary
it can be remarked that there are more short and below the standard as well as
a lower average height among the latter. The tallest individuals among the Swedish
inhabitants are found in Åland and the south*west archipelago, where the popula*
tion in regard to height corresponds with the tall grown population of adjacent
parts of Sweden. Hence the height decreases with a surprising regularity in
correspondence with the rest of the Swedish provinces as well as to the interiör
<< prev. page << föreg. sida << >> nästa sida >> next page >>