
Full resolution (JPEG) - On this page / på denna sida - 1958, H. 5 - Flashover Characteristics of Non-uniform Spark Gaps with Standard 1×50 Impulses, by Jörgen Fryxell
<< prev. page << föreg. sida << >> nästa sida >> next page >>
Below is the raw OCR text
from the above scanned image.
Do you see an error? Proofread the page now!
Här nedan syns maskintolkade texten från faksimilbilden ovan.
Ser du något fel? Korrekturläs sidan nu!
This page has never been proofread. / Denna sida har aldrig korrekturlästs.
even with a test series of moderate length. In the
present investigation of course all points have been
used. When the same construction is made on a
S-curve especially in cases where the test series are
so short that it is not clear that a non-Gaussian
distribution is present it can be expected to give
quite misleading results.
Therefore, a new approach to a solution was tried
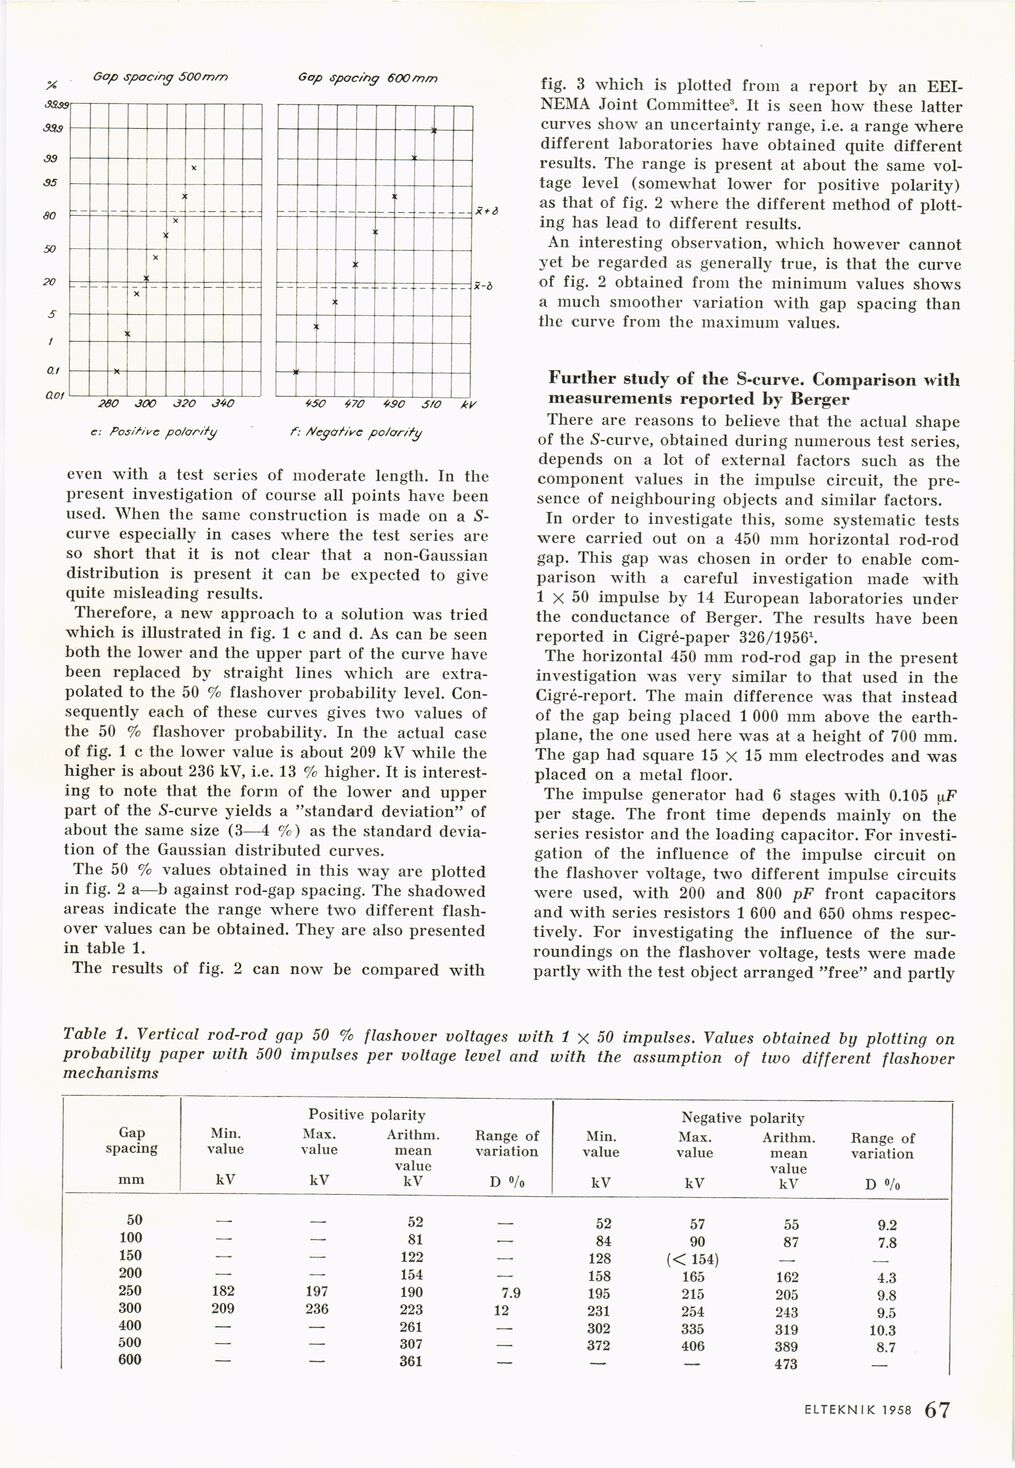
which is illustrated in fig. 1 c and d. As can be seen
both the lower and the upper part of the curve have
been replaced by straight lines which are
extrapolated to the 50 % flashover probability level.
Consequently each of these curves gives two values of
the 50 % flashover probability. In the actual case
of fig. 1 c the lower value is about 209 kV while the
higher is about 236 kV, i.e. 13 % higher. It is
interesting to note that the form of the lower and upper
part of the 5-curve yields a "standard deviation" of
about the same size (3—4 %) as the standard
deviation of the Gaussian distributed curves.
The 50 % values obtained in this way are plotted
in fig. 2 a—b against rod-gap spacing. The shadowed
areas indicate the range where two different
flash-over values can be obtained. They are also presented
in table 1.
The results of fig. 2 can now be compared with
fig. 3 which is plotted from a report by an
EEI-NEMA Joint Committee3. It is seen how these latter
curves show an uncertainty range, i.e. a range where
different laboratories have obtained quite different
results. The range is present at about the same
voltage level (somewhat lower for positive polarity)
as that of fig. 2 where the different method of
plotting has lead to different results.
An interesting observation, which however cannot
yet be regarded as generally true, is that the curve
of fig. 2 obtained from the minimum values shows
a much smoother variation with gap spacing than
the curve from the maximum values.
Further study of the S-curve. Comparison with
measurements reported by Berger
There are reasons to believe that the actual shape
of the 5-curve, obtained during numerous test series,
depends on a lot of external factors such as the
component values in the impulse circuit, the
presence of neighbouring objects and similar factors.
In order to investigate this, some systematic tests
were carried out on a 450 mm horizontal rod-rod
gap. This gap was chosen in order to enable
comparison with a careful investigation made with
1 X 50 impulse by 14 European laboratories under
the conductance of Berger. The results have been
reported in Cigré-paper 326/19561.
The horizontal 450 mm rod-rod gap in the present
investigation was very similar to that used in the
Cigré-report. The main difference was that instead
of the gap being placed 1 000 mm above the
earth-plane, the one used here was at a height of 700 mm.
The gap had square 15 X 15 mm electrodes and was
placed on a metal floor.
The impulse generator had 6 stages with 0.105 uF
per stage. The front time depends mainly on the
series resistor and the loading capacitor. For
investigation of the influence of the impulse circuit on
the flashover voltage, two different impulse circuits
were used, with 200 and 800 pF front capacitors
and with series resistors 1 600 and 650 ohms
respectively. For investigating the influence of the
surroundings on the flashover voltage, tests were made
partly with the test object arranged "free" and partly
Table 1. Vertical rod-rod gap 50 % flashover voltages with 1 X 50 impulses. Values obtained by plotting on
probability paper with 500 impulses per voltage level and with the assumption of two different flashover
mechanisms
Positive polarity
Gap Min. Max. Arithm
spacing value value mean
value
mm kV kV kV
50 — — 52 — 52 57 55 9.2
100 — — 81 — 84 90 87 7.8
150 — — 122 — 128 (< 154) — —
200 — — 154 — 158 165 162 4.3
250 182 197 190 7.9 195 215 205 9.8
300 209 236 223 12 231 254 243 9.5
400 — — 261 — 302 335 319 10.3
500 — — 307 — 372 406 389 8.7
600 — — 361 — — — 473 —
Negative polarity
Range of Min. Max. Arithm. Range of
variation value value mean variation
value
D °/o kV kV kV D °/o
ELTEKNIK 1958 1 1 9
<< prev. page << föreg. sida << >> nästa sida >> next page >>