Full resolution (JPEG) - On this page / på denna sida - Sidor ...

<< prev. page << föreg. sida << >> nästa sida >> next page >>
Below is the raw OCR text
from the above scanned image.
Do you see an error? Proofread the page now!
Här nedan syns maskintolkade texten från faksimilbilden ovan.
Ser du något fel? Korrekturläs sidan nu!
This page has never been proofread. / Denna sida har aldrig korrekturlästs.
104
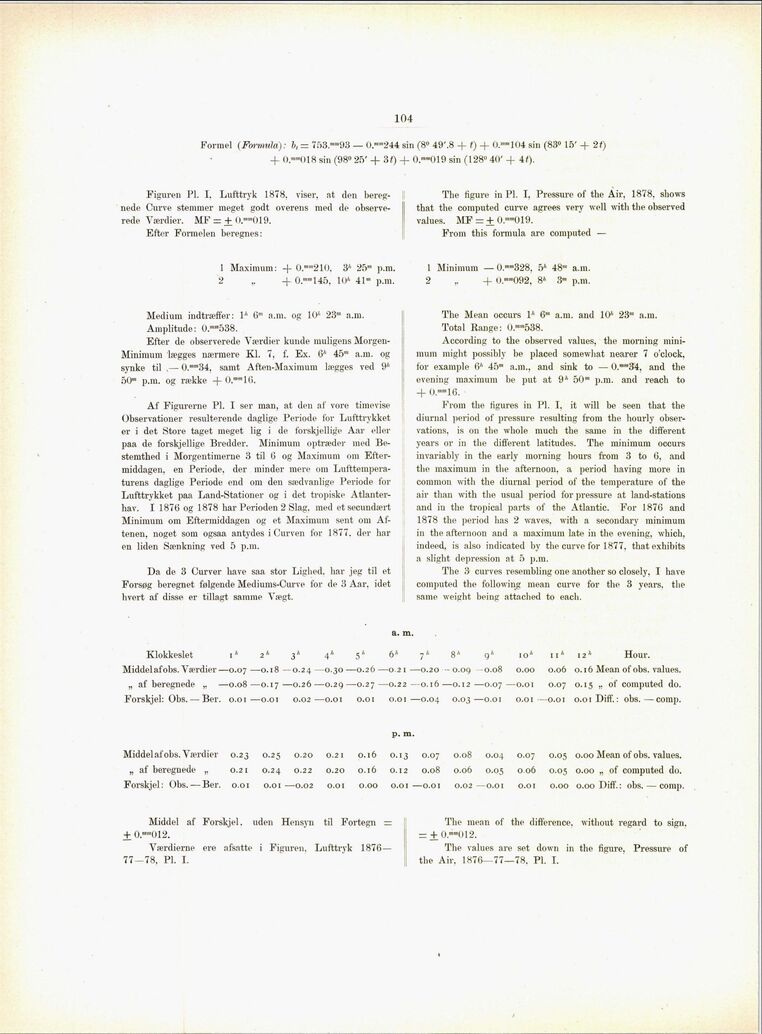
Formel (Formula): bt = 753.""93 — 0.—244 sin (8° 49’.8 -f f) + 0.–104 sin (83° 15’ + 2f)
+ 0.mm()18 sin (98° 25’ + St) + 0.m"019 sin (128° 40’ + 40-
Figuren Pl. I. Lufttryk 1878. viser, at den
beregnede Curve stemmer meget godt overens med de
observerede Værdier. MF = + 0.""019.
Efter Formelen beregnes:
1 Maximum: -f 0.""210. 3A 25™ p.m.
2 + 0.mml45, 10* 41m p.m.
Medium indtræffer: 1* 6m a.m. og IO7’ 23™ a.m.
Amplitude: 0.™"538.
Efter de observerede Værdier kunde muligens
Morgen-Minimum lægges nærmere Kl. 7, f. Ex. 6A 45m a.m. og
synke til ,— 0.mm34, samt Aften-Maximum lægges ved 9’’
50m p.m. og række —f— 0.mm 1C3.
Af Figurerne Pl. I ser man, at den af vore timevise
Observationer resulterende daglige Periode for Lufttrykket
er i det Store taget meget lig i de forskjellige Aar eller
paa de forskjellige Bredder. Minimum optræder med
Bestemthed i Morgentimerne 3 til 6 og Maximum om
Eftermiddagen, en Periode, der minder mere om
Lufttemperaturens daglige Periode end om den sædvanlige Periode for
Lufttrykket paa Land-Stationer og i det tropiske
Atlanterhav. I 1876 og 1878 har Perioden 2 Slag. med etsecundært
Minimum om Eftermiddagen og et Maximum sent om
Aftenen, noget som ogsaa antydes i Curven for 1877. der har
en liden Sænkning ved 5 p.m.
Da de 3 Curver have saa stor Lighed, har jeg til et
Forsøg beregnet følgende Mediums-Curve for de 3 Aar. idet
hvert af disse er tillagt samme Vægt.
a. m.
Klokkeslet ih 2h 3’’ 4’’ 5* 6’’ 7* 8* 9* ioA 11* 12’’ Hour.
Middel af obs. Værdier—0.07—0.18—0.24—0.30—0.26—0.21—0.20 —0.09 -0.08 0.00 0.06 o. 16 Mean of obs. values.
„ af beregnede „ —0.08—0.17—0.26—0.29—0.27—0.22—0.16—0.12—0.07—o.oi 0.07 0.15 „ of computed do.
Forskjel: Obs. — Ber. o.oi—0.01 0.02—0.01 0.01 0.01—0.04 0.03—0.01 0.01—0.01 0.01 Diff.: obs.—comp.
p. m.
Middel af obs. Værdier 0.23 0.25 0.20 0.21 0.16 0.13 0.07 0.08 0.04 0.07 0.05 0.00 Mean of obs. values.
„ af beregnede „ 0.21 0.24 0.22 0.20 0.16 0.12 0.08 0.06 0.05 0.06 0.05 0.00 „ of computed do.
Forskjel: Obs. — Ber. 0.01 0.01—0.02 0.01 0.00 0.01—0.01 0.02—0.01 0.01 0.00 0.00 Diff.: obs. — comp.
The mean of the difference, without regard to sign.
= + 0>«012.
The values are set down in the figure, Pressure of
the Air, 1876—77—78, Pl. I.
The figure in Pl. I, Pressure of the Air, 1878, shows
that the computed curve agrees very well with the observed
values. MF = +0.""019.
From this formula are computed —
1 Minimum — 0.ram328, 5A 48m a.m.
2 -f 0.mra092, 8A 3™ p.m.
The Mean occurs 1A 6m a.m. and IO’ 23™ a.m.
Total Range: 0.mm538.
According to the observed values, the morning
minimum might possibly be placed somewhat nearer 7 o’clock,
for example 6A 45™ a.m., and sink to — 0.mm34, and the
evening maximum be put at 9A 50™ p.m. and reach to
+ 0.–16.
From the figures in Pl. I, it will be seen that the
diurnal period of pressure resulting from the hourly
observations, is on the whole much the same in the different
years or in the different latitudes. The minimum occurs
invariably in the early morning hours from 3 to 6, and
the maximum in the afternoon, a period having more in
common with the diurnal period of the temperature of the
air than with the usual period for pressure at land-stations
and in the tropical parts of the Atlantic. For 1876 and
1878 the period has 2 waves, with a secondary minimum
in the afternoon and a maximum late in the evening, which,
indeed, is also indicated by the curve for 1877, that exhibits
a slight depression at 5 p.m.
The 3 curves resembling one another so closely, I have
computed the following mean curve for the 3 years, the
same weight being attached to each.
Middel af Forskjel, uden Hensyn til Fortegn =
+ 0.mm012.
Værdierne ere afsatte i Figuren. Lufttryk 1876—
77-78, Pl. I.
<< prev. page << föreg. sida << >> nästa sida >> next page >>