
Full resolution (JPEG) - On this page / på denna sida - First part - II. The Swedish People - 2. Demography of Sweden - Division of the population according to age - Population according to sex
<< prev. page << föreg. sida << >> nästa sida >> next page >>
Below is the raw OCR text
from the above scanned image.
Do you see an error? Proofread the page now!
Här nedan syns maskintolkade texten från faksimilbilden ovan.
Ser du något fel? Korrekturläs sidan nu!
This page has never been proofread. / Denna sida har aldrig korrekturlästs.
112 II. TH B SWEDISH PEOPLE.
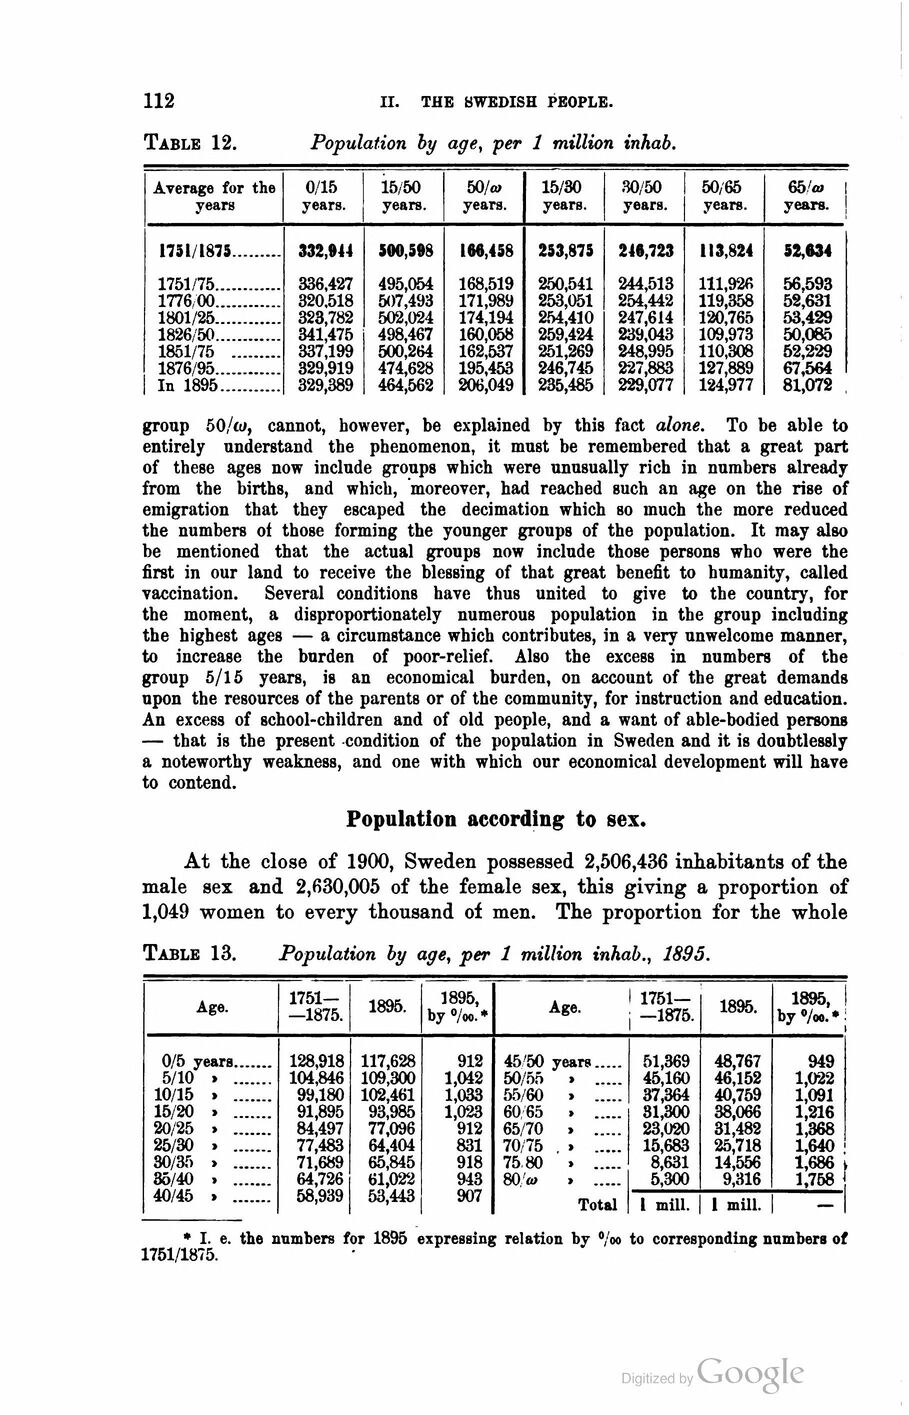
Table 12. Population by age, per 1 million inhab.
Average for the years 0/15 years. 15/50 years. 50 la years. 15/30 years. 30/50 years. 50/65 years. 65 !m years.
1751/1875......... 332,944 500,598 166,458 253,875 240,723 113,824 52,634
1751/75........................336,427 495,054 168,519 250,541 244,513 111,926 56,593
1776,00........................320.518 507,493 171,989 253,051 254,442 119,358 52,631
1801/25........................323,782 502,024 174,194 254,410 247,614 120,765 53,429
1826/50 ........................341,475 498,467 160,058 259,424 239,043 109,973 50,085
1851/75 ..................337,199 500,264 162,537 251,269 248,995 110,308 52,229
1876/95........................329,919 474,628 195,453 246,745 227,883 127,889 67,564
In 1895 ......................329,389 464,562 206,049 235,485 229,077 124,977 81,072
group 50/to, cannot, however, be explained by this fact alone. To be able to
entirely understand the phenomenon, it must be remembered that a great part
of these ages now include groups which were unusually rich in numbers already
from the births, and which, moreover, had reached such an age on the rise of
emigration that they escaped the decimation which so much the more reduced
the numbers ol those forming the younger groups of the population. It may also
be mentioned that the actual groups now include those persons who were the
first in our land to receive the blessing of that great benefit to humanity, called
vaccination. Several conditions have thus united to give to the country, for
the moment, a disproportionately numerous population in the group including
the highest ages — a circumstance which contributes, in a very unwelcome manner,
to increase the burden of poor-relief. Also the excess in numbers of the
group 5/15 years, is an economical burden, on account of the great demands
upon the resources of the parents or of the community, for instruction and education.
An excess of school-children and of old people, and a want of able-bodied persons
— that is the present condition of the population in Sweden and it is doubtlessly
a noteworthy weakness, and one with which our economical development will have
to contend.
Population according to sex.
At the close of 1900, Sweden possessed 2,506,436 inhabitants of the
male sex and 2,630,005 of the female sex, this giving a proportion of
1,049 women to every thousand of men. The proportion for the whole
Table 13. Population by age, per 1 million inhab., 1895.
Age. [-1751-—1875.-] {+1751- —1875.+} 1895. 1895, by °/oo. *
* I. e. the numbers for 1895 expressing relation by °/oo to corresponding numbers of
1751/1875.
0/5 years..............128,918 117,628 912
5/10 » ..............104,846 109,300 1,042
10/15 > ..............99,180 102,461 1,033
15/20 » ..............91,895 93,985 1,023
20/25 » ..............84,497 77,096 912
25/30 » ..............77,483 64,404 831
30/35 » ..............71,689 65,845 918
35/40 > ..............64,726 61,022 943
40/45 » ..............58,939 53,443 907
45’50 years..........51,369 48,767 949
50/55 > ..........45,160 46,152 1,022
55/60 » ..........37,364 40,759 1,091
6065 » ..........31,300 38,066 1,216
65/70 » ..........23,020 31,482 1,368
70/75 . » ..........15,683 25,718 1,640
75 80 » ..........8,631 14,556 1,686
80> » ..........5,300 9,316 1,758
Total 1 mill. 1 mill. | —
<< prev. page << föreg. sida << >> nästa sida >> next page >>