
Full resolution (JPEG) - On this page / på denna sida - VI. Mining and Metallurgical Industry. General Survey. By C. Sahlin - 1. Mining. By Valfrid Petersson
<< prev. page << föreg. sida << >> nästa sida >> next page >>
Below is the raw OCR text
from the above scanned image.
Do you see an error? Proofread the page now!
Här nedan syns maskintolkade texten från faksimilbilden ovan.
Ser du något fel? Korrekturläs sidan nu!
This page has never been proofread. / Denna sida har aldrig korrekturlästs.
output and export of iron ore. 251
million tons of iron, of which 750 million tons fall to the ore fields of
Lappland.
Output and Export of Iron Ore.
The annual amount of iron ore mined in Sweden during the last
decades figures out as follows:
Annually Tons
1833—40 .... 235 000
1841-50 .... 270 000
1851—60 .... 349 000
1861-65 .... 464 363
1866-70 .... 553 759
1871-75 .... 795 263
1876—80 .... 726 712
1881-85 .... 877 408
1886—90 .... 932 470
1891-95 . . . . 1 519 325
1896—00 . . . . 2 294 760
1901—05 . . . . 3 564 046
1906—10 . . . . 4 626 913
1911 ...... 6 150 718
1912 ...... 6 699 226
1913 ...... 7 475 571
The output of ore in Sweden for 1912 was 6 699 226 tons. As the total
output for the world in the same year may be computed at 157 million
tons, it follows that Sweden’s contribution was about 4-3 %.
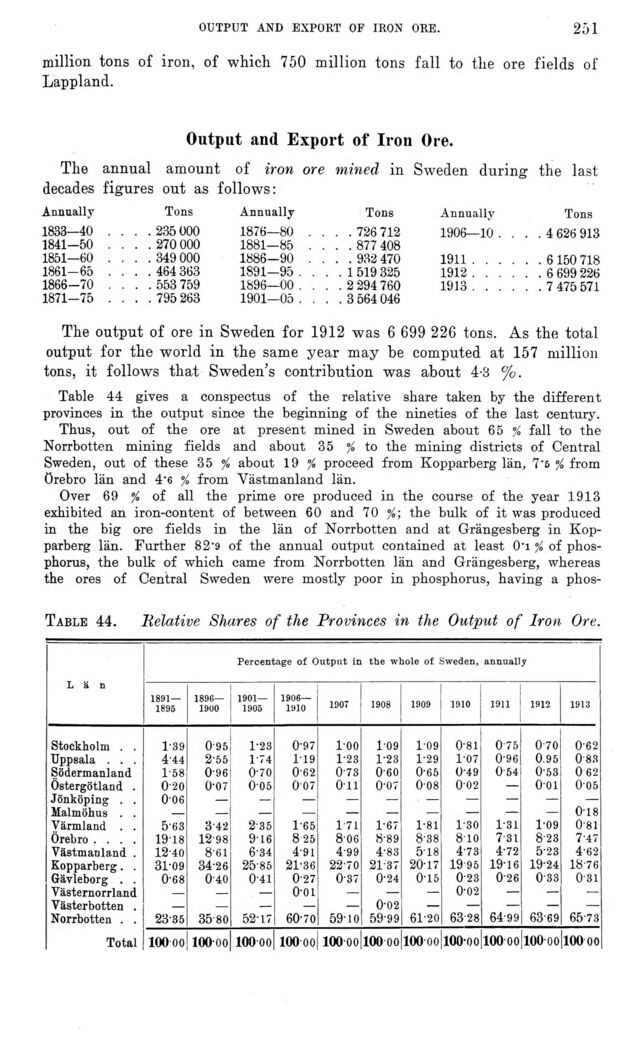
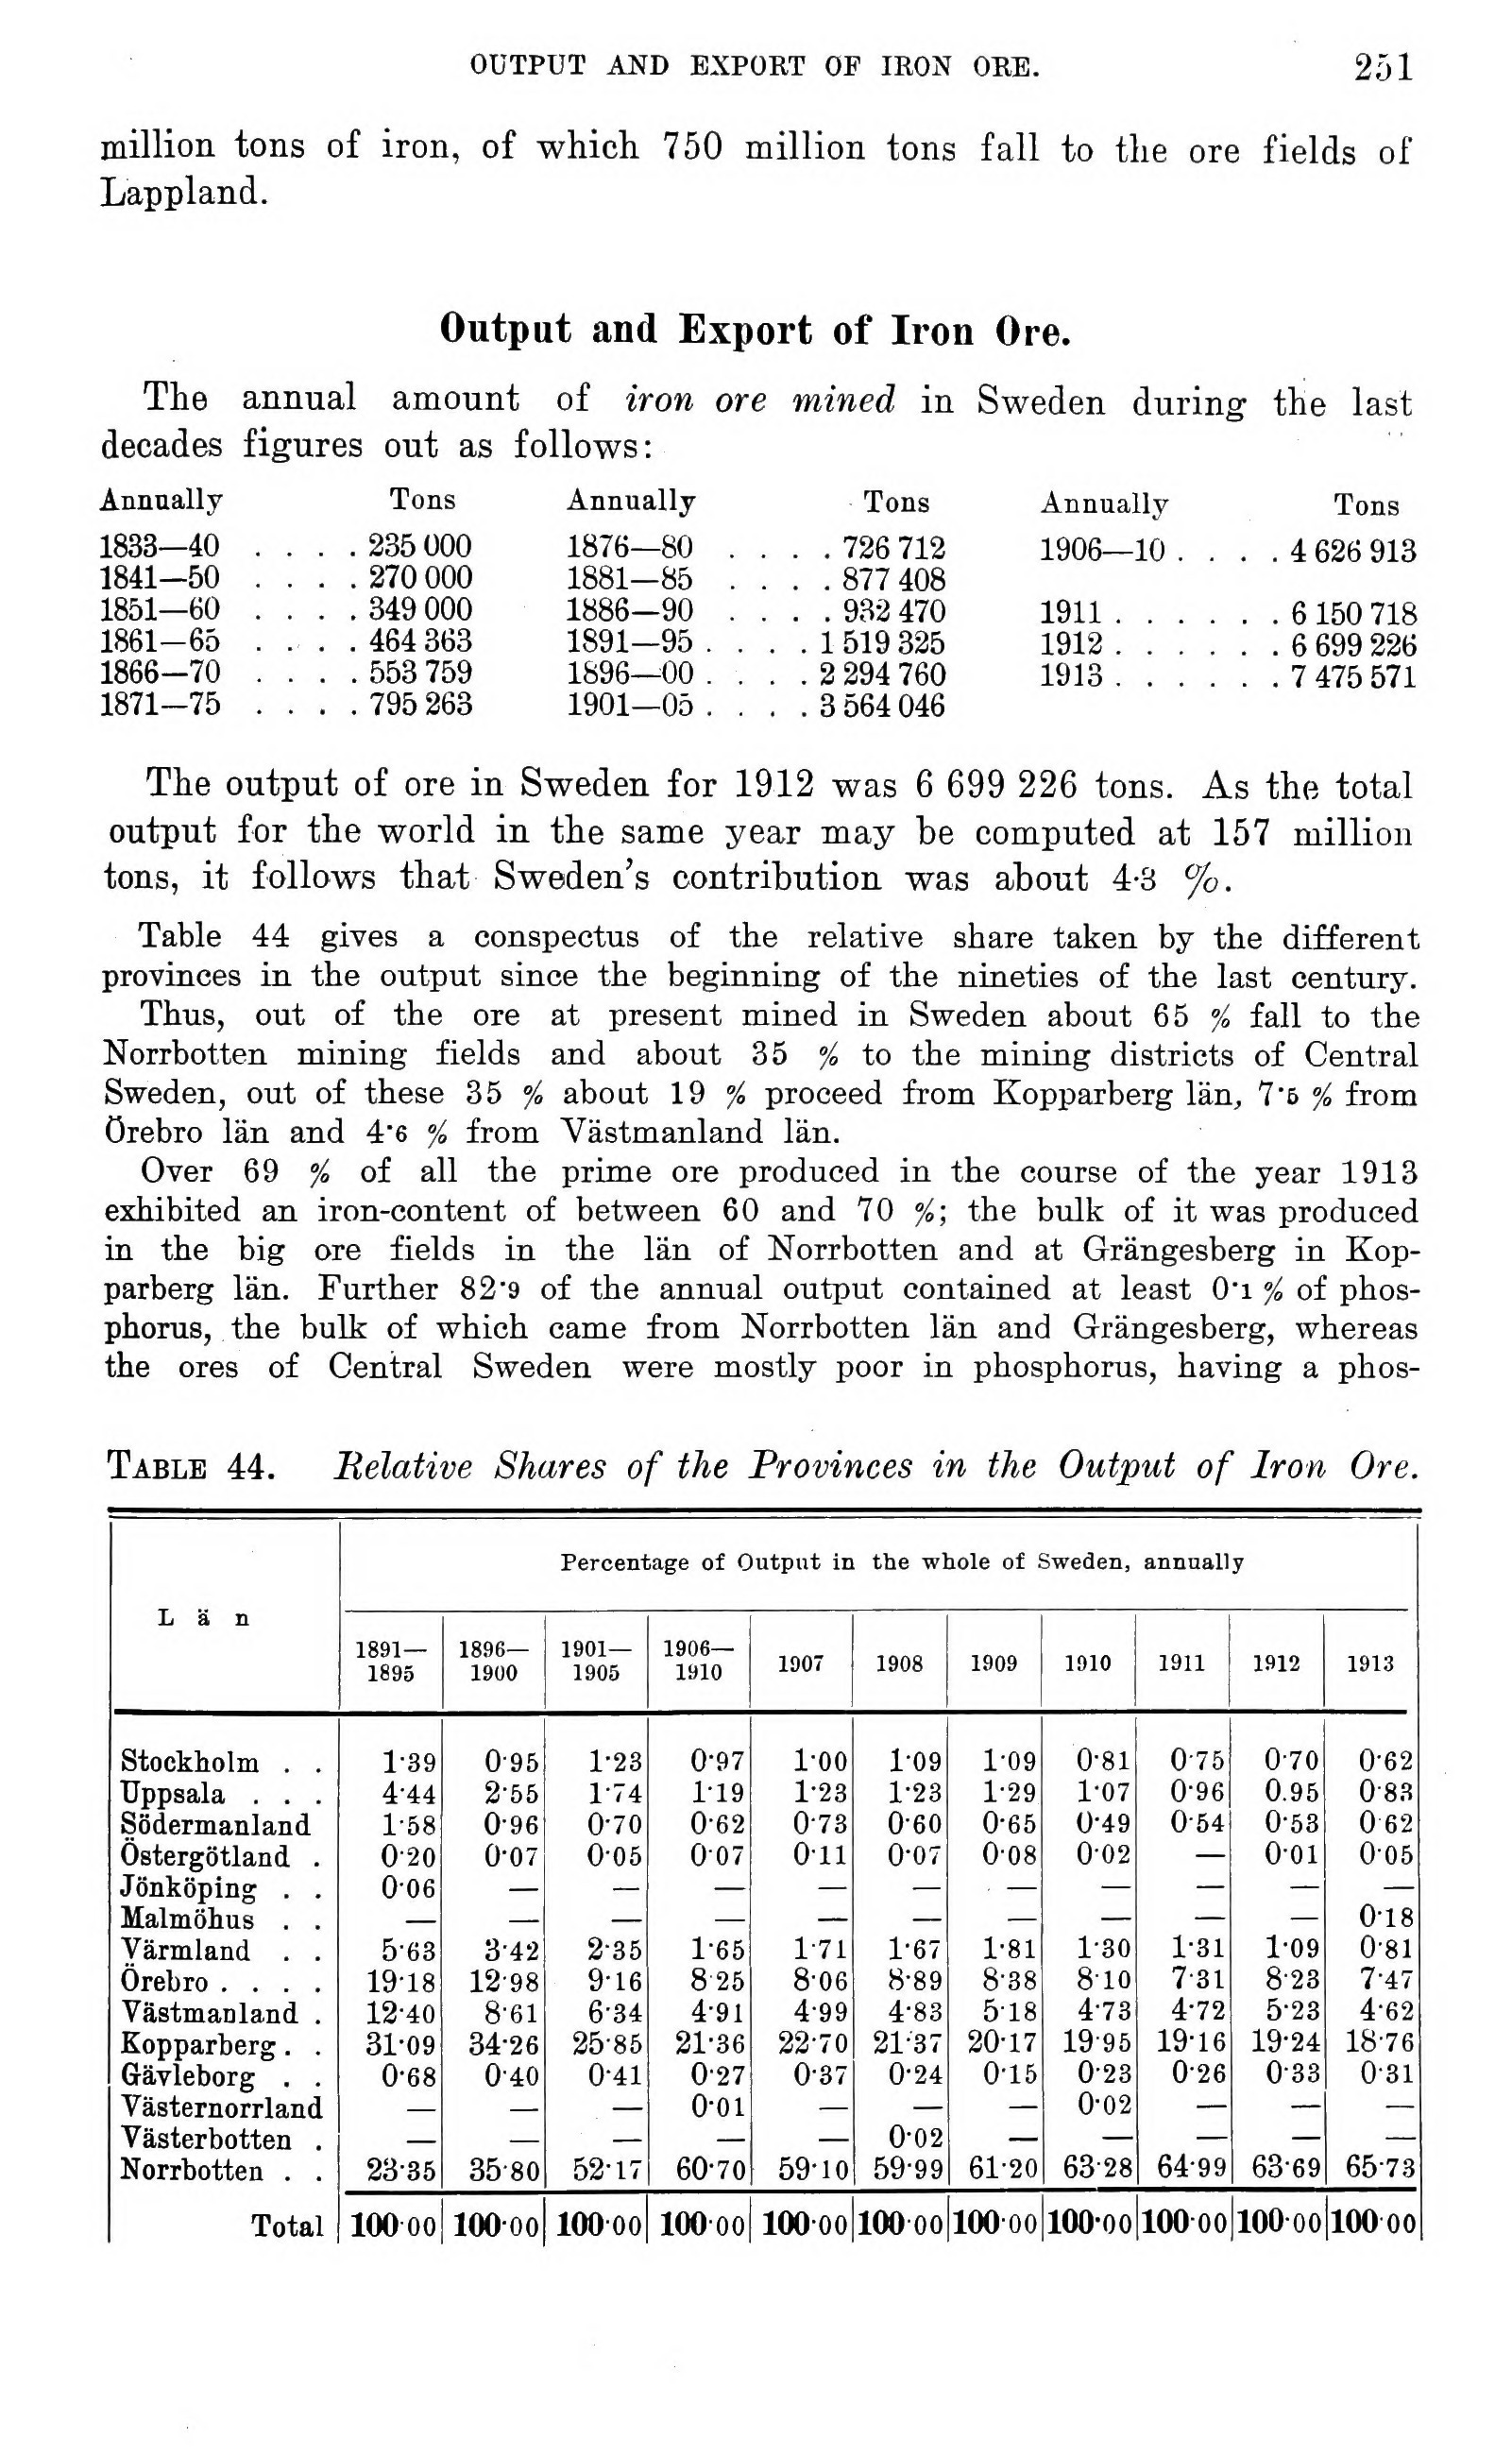
Table 44 gives a conspectus of the relative share taken by the different
provinces in the output since the beginning of the nineties of the last century.
Thus, out of the ore at present mined in Sweden about 65 % fall to the
Norrbotten mining fields and about 35 % to the mining districts of Central
Sweden, out of these 35 % about 19 % proceed from Kopparberg Ian, 7’6 % from
Örebro län and 4"6 % from Västmanland län.
Over 69 % of all the prime ore produced in the course of the year 1913
exhibited an iron-content of between 60 and 70 the bulk of it was produced
in the big ore fields in the län of Norrbotten and at Grängesberg in
Kopparberg län. Further 82’9 of the annual output contained at least 0"i % of
phosphorus, the bulk of which came from Norrbotten län and Grängesberg, whereas
the ores of Central Sweden were mostly poor in phosphorus, having a phos-
Table 44. Relative Shares of the Provinces in the Output of Iron Ore.
Percentage of Output in the whole of Sweden, annually
Län 1891 — 1896— 1901— 1906—
1895 1900 1905 1910 1907 1908 1909 1910 1911 1912 1913
Stockholm . . 1-39 0-95 1-23 0-97 l-oo 1-09 1-09 0-81 0-75 0-70 0-62
Uppsala . . . 444 2-55 1-74 1-19 1-23 1-23 1-29 1-07 0-96 0.95 0 83
Södermanland 1-58 0-96 0-70 0-62 0-73 0-60 0-65 0-49 0-54 0-53 0 62
Östergötland . 0-20 0-07 005 007 011 0-07 0-08 002 — 0-01 0-05
Jönköping . . 006 — — — — — — — — — —
Malmöhus . . — — — — — — — — — — 0-18
Värmland . . 5-63 3-42 235 1-65 1-71 1-67 1-81 1-30 1-31 1-09 0-81
Örebro .... 19-18 12-98 9-16 8 25 8-06 8-89 8-38 8-10 7-31 8-23 7-47
Västmanland . 12-40 8-61 634 4-91 4-99 4-83 518 4-73 4-72 5-23 4-62
Kopparberg. . 31-09 34-26 25-85 21-36 22-70 21-37 20-17 1995 19-16 19-24 18-76
Gävleborg . . 0-68 0-40 0-41 0-27 0-37 0-24 015 0-23 0-26 0-33 0-31
Västernorrland — — — 0-01 — — — 0-02 — — —
Västerbotten . — — — — — 0-02 — — — — —
Norrbotten . . 23-35 35 80 52-17 60-70 59-10 59-99 61-20 63-28 64-99 63-69 65-73
Total 100-00 100-oo lOOoo 100-00 lOOoo 100 00 lOOoo lOO-oo 100 00 lOO-oo lOOoo
<< prev. page << föreg. sida << >> nästa sida >> next page >>