Note: Gunnar Myrdal died in 1987, less than 70 years ago. Therefore, this work is protected by copyright, restricting your legal rights to reproduce it. However, you are welcome to view it on screen, as you do now. Read more about copyright.

Full resolution (TIFF) - On this page / på denna sida - IV. Economics - 13. Seeking Jobs Outside Agriculture - 8. The Size of the Negro Labor Force and Negro Employment
<< prev. page << föreg. sida << >> nästa sida >> next page >>
Below is the raw OCR text
from the above scanned image.
Do you see an error? Proofread the page now!
Här nedan syns maskintolkade texten från faksimilbilden ovan.
Ser du något fel? Korrekturläs sidan nu!
This page has never been proofread. / Denna sida har aldrig korrekturlästs.
An American Dilemma
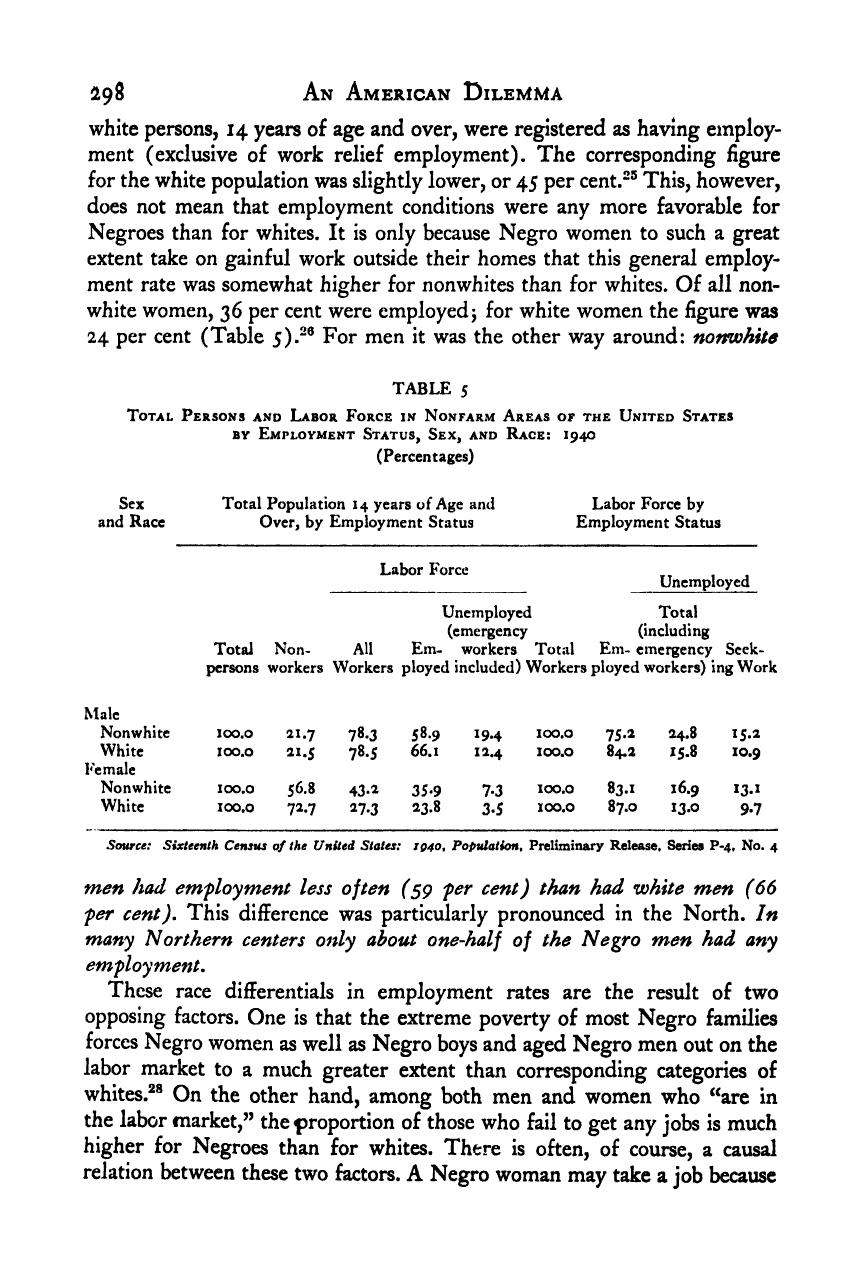
white persons, 14 years of age and over, were registered as having employ-
ment (exclusive of work relief employment). The corresponding figure
for the white population was slightly lower, or 45 per cent.“® This, however,
does not mean that employment conditions were any more favorable for
Negroes than for whites. It is only because Negro women to such a great
extent take on gainful work outside their homes that this general employ-
ment rate was somewhat higher for nonwhites than for whites. Of all non-
white women, 36 per cent were employed j
for white women the figure was
24 per cent (Table 5).“® For men it was the other way around: nomohite
TABLE 5
Total Persons and Labor Force in Nonfarm Areas of the United States
BY Employment Status, Sex, and Race: 1940
(Percentages)
Sex Total Population 14 years of Age ami Labor Force by
and Race Over, by Employment Status Employment Status
Labor Force
Unemployed
Unemployed Total
(emergency (including
Total Non- All Em- workers Total Em- emergency Seek-
persons workers Workers ployed included) Workers ployed workers) ing Work
Male
Nonwhitc 100.0 21.7 78.3 58.9 19.4 100.0 75.2 24.8 15.2
White 100.0 21.5 78.S 66.1 12.4 100.0 84.2 15.8 10.9
Female
Nonwhite 100.0 56.8 43*1 35-9 7-3 100.0 83.1 16.9 13.1
White 100.0 72.7 27.3 23.8 3.5 100.0 87.0 13-0 9-7
Source: Sixteenth Census of the United States: IQ40, Population, Preliminary Release, Series P-4, No. 4
men had employment less often (sg per cent) than had white men (66
per cent). This difference was particularly pronounced in the North. In
many Northern centers only about one-half of the Negro men had any
employment.
These race differentials in employment rates are the result of two
opposing factors. One is that the extreme poverty of most Negro families
forces Negro women as well as Negro boys and aged Negro men out on the
labor market to a much greater extent than corresponding categories of
whites.^® On the other hand, among both men and women who ^‘are in
the labor market,” the proportion of those who fail to get any jobs is much
higher for Negroes than for whites. There is often, of course, a causal
relation between these two factors. A Negro woman may take a job because
<< prev. page << föreg. sida << >> nästa sida >> next page >>