
Full resolution (JPEG) - On this page / på denna sida - II. The Swedish People - 2. Demography. By [G. Sundbärg] E. Arosenius

<< prev. page << föreg. sida << >> nästa sida >> next page >>
Below is the raw OCR text
from the above scanned image.
Do you see an error? Proofread the page now!
Här nedan syns maskintolkade texten från faksimilbilden ovan.
Ser du något fel? Korrekturläs sidan nu!
This page has never been proofread. / Denna sida har aldrig korrekturlästs.
lif) II. THE SWEDISH PEOPLE.
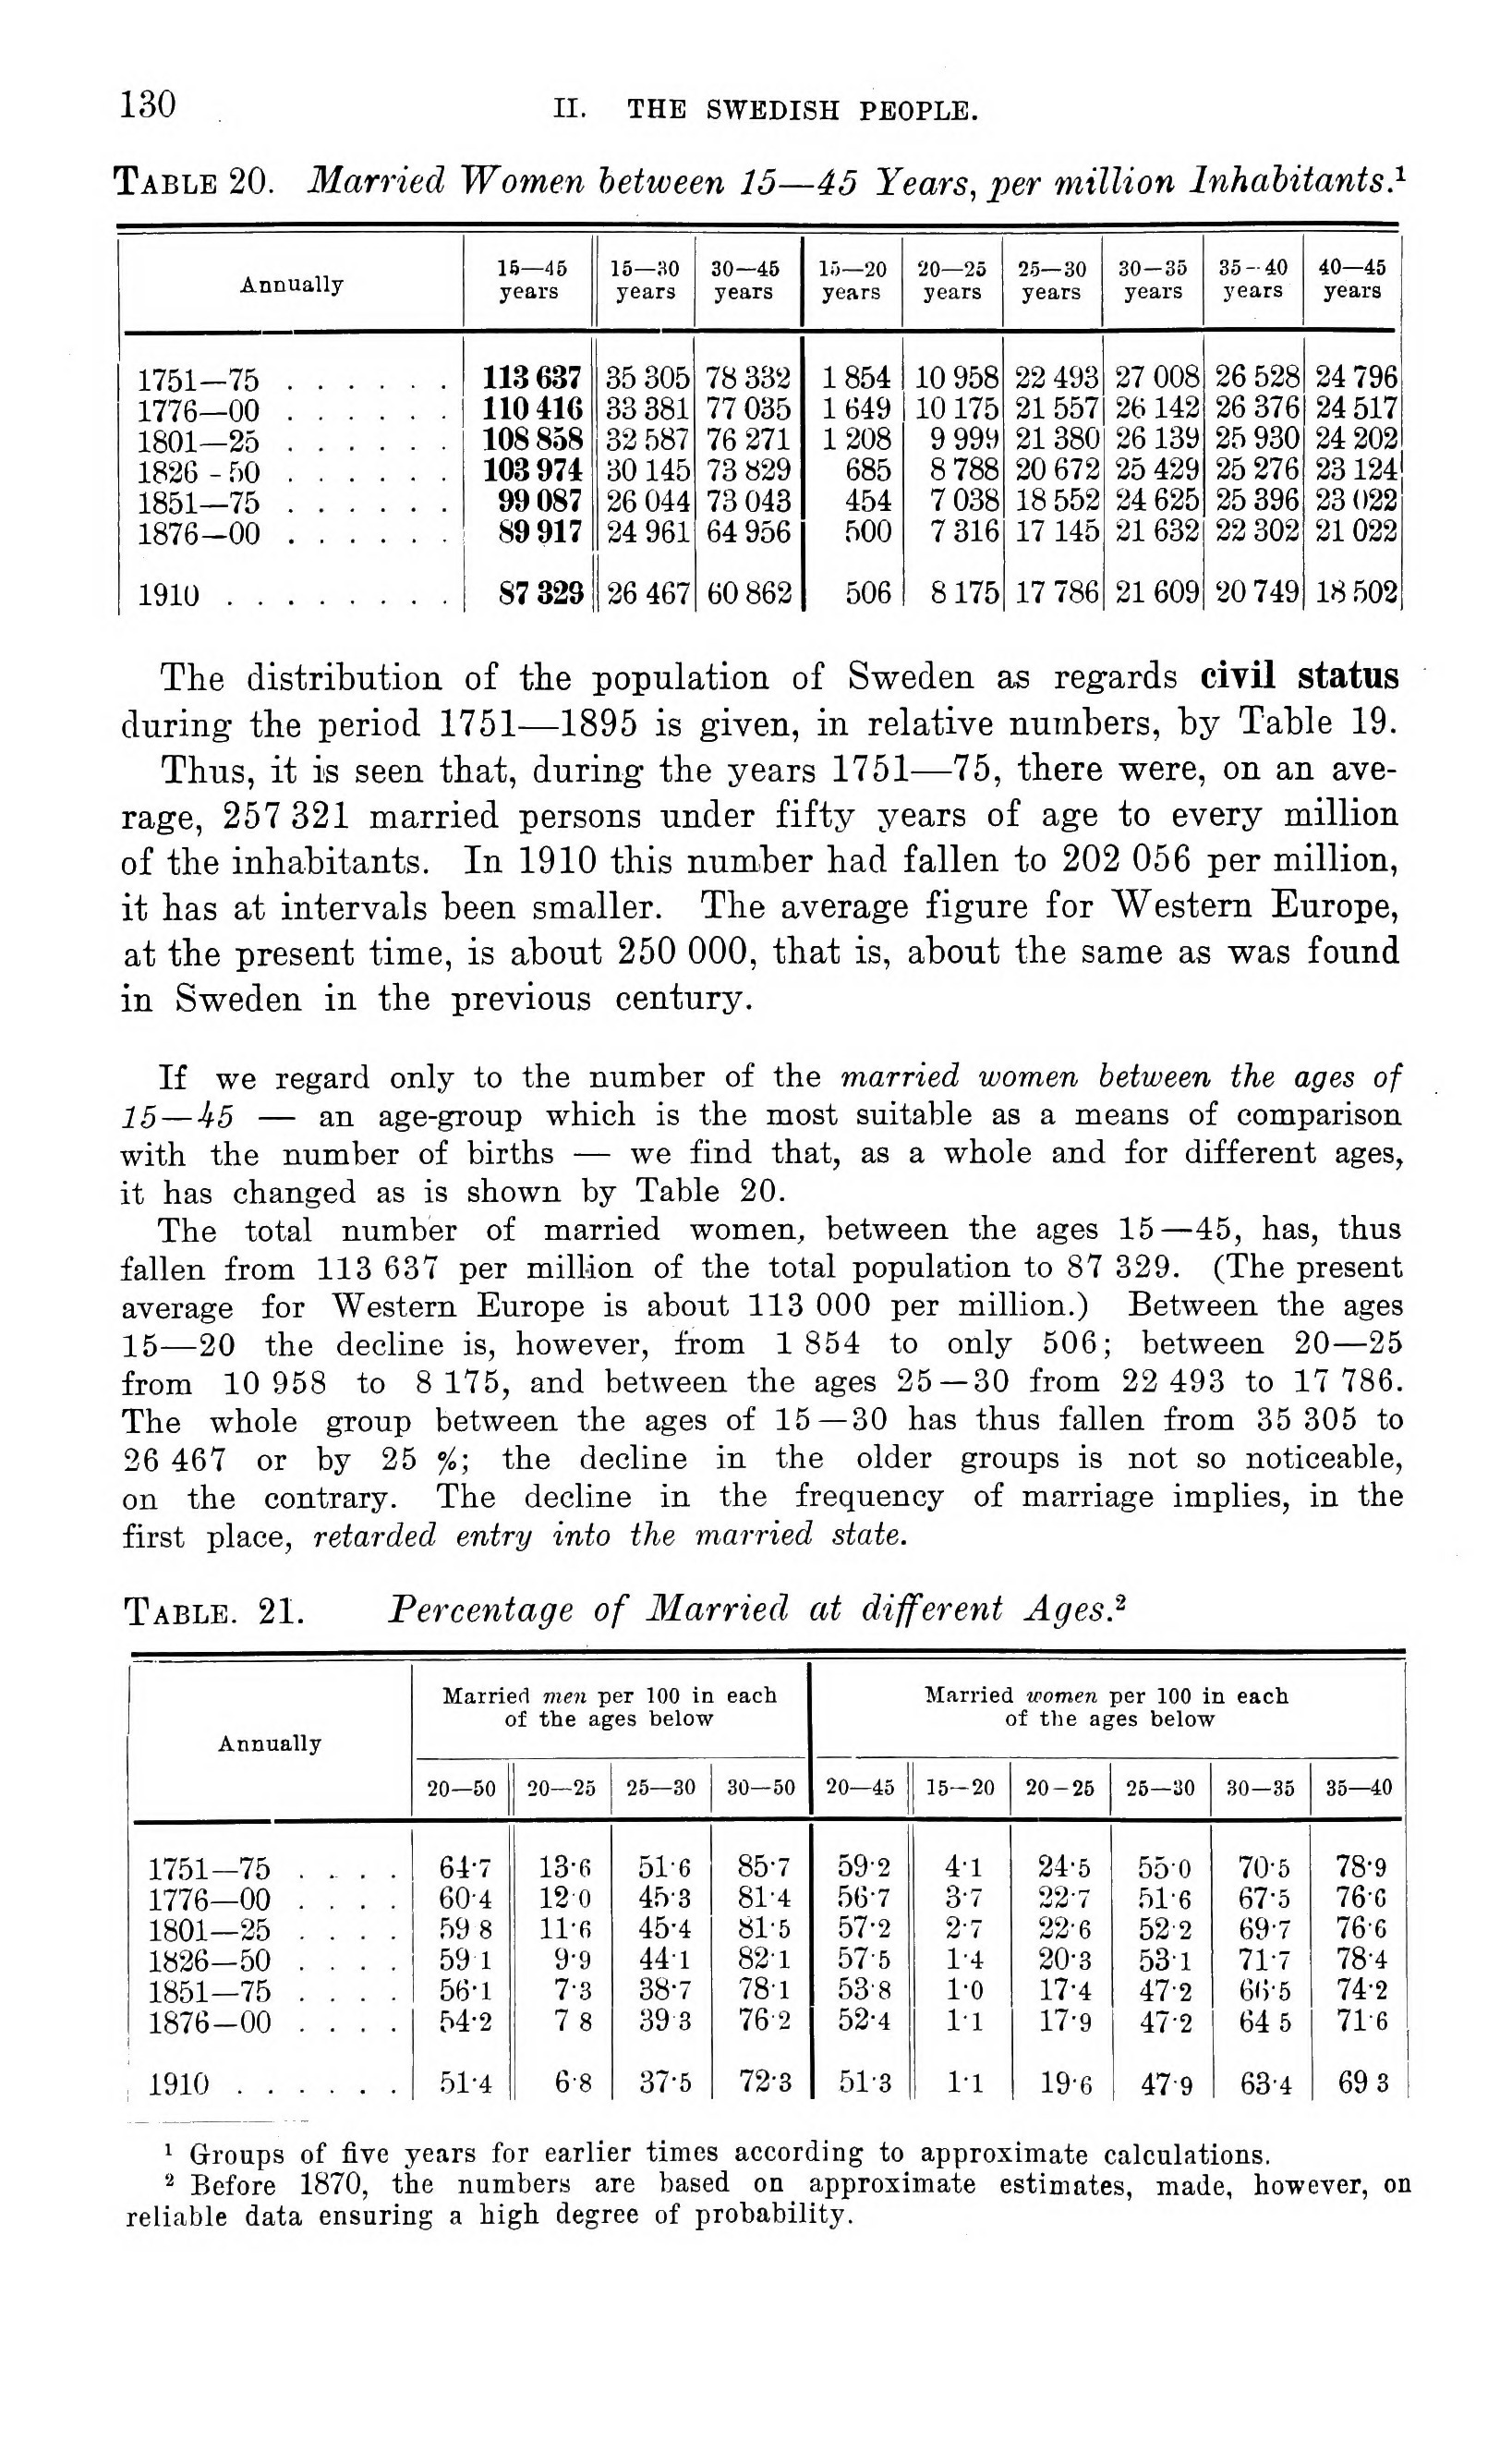
Table 20. Married Women between 15—45 Years, per million Inhabitants.1
Annually 16—45 years 15—30 years 30-45 years 15—20 years 20—25 years 25—30 years 30-35 years 35-40 years 40—45 years
1751-75 ...... 113 637 35 305 78 332 1854 10 958 22 493 27 008 26 528 24 796
1776—00 ...... 110 416 33 381 77 035 1649 10 175 21 557 26 142 26 376 24 517
1801—25 ...... 108 858 32 587 76 271 1208 9 999 21 380 26 139 25 930 24 202
1826 - 50 ...... 103 974 30 145 73 829 685 8 788 20 672 25 429 25 276 23124
1851—75 ...... 99 087 26 044 73 043 454 7 038 18 552 24 625 25 396 23 022
1876-00 ...... 89 917 24 961 64 956 500 7 316 17 145 21 632 22 302 21022
1910........ 87 329 26 467 60 862 506 8175 17 786 21609 20 749 18 502
The distribution of the population of Sweden as regards civil status
during the period 1751—1895 is given, in relative numbers, by Table 19.
Thus, it is seen that, during the years 1751—75, there were, on an
average, 257 321 married persons under fifty years of age to every million
of the inhabitants. In 1910 this number had fallen to 202 056 per million,
it has at intervals been smaller. The average figure for Western Europe,
at the present time, is about 250 000, that is, about the same as was found
in Sweden in the previous century.
If we regard only to the number of the married women between the ages of
15 — 45 — an age-group which is the most suitable as a means of comparison
with the number of births — we find that, as a whole and for different ages,
it has changed as is shown by Table 20.
The total number of married women, between the ages 15—45, has, thus
fallen from 113 637 per million of the total population to 87 329. (The present
average for Western Europe is about 113 000 per million.) Between the ages
15—20 the decline is, however, from 1 854 to only 506; between 20—25
from 10 958 to 8 175, and between the ages 25—30 from 22 493 to 17 786.
The whole group between the ages of 15—30 has thus fallen from 35 305 to
26 467 or by 25 %•, the decline in the older groups is not so noticeable,
on the contrary. The decline in the frequency of marriage implies, in the
first place, retarded entry into the married state.
Table. 21. Percentage of Married at different Ages?
Annually Married men per 100 in each of the ages below Married women per 100 in each of the ages below
20—50 20—25 25—30 30—50 20—45 15-20 20-26 25—30 30-35 35—40
1751-75 .... 64-7 13-6 51-6 85’7 59-2 41 24-5 550 70-5 78-9
1776—00 .... 60’4 12 0 45-3 81-4 56-7 3’7 22-7 51-6 67-5 76 c
1801—25 .... 59 8 ll’fi 45-4 81-5 57-2 2-7 22’6 522 69-7 760
1826-50 .... 59 l 9-9 44l 821 575 1-4 20-3 53-1 71-7 78’4
1851-75 .... 56-1 7-3 38-7 78-1 538 l-o 17-4 47-2 66-5 74-2
1876-00 .... 54-2 7 8 39 3 762 52-4 11 17-9 47-2 64 5 71-6
1910...... 51’4 6-8 37-5 72-3 51:$ l’l 19-6 47-9 63-4 69 3
1 Groups of five years for earlier times according to approximate calculations.
2 Before 1870, the numbers are based on approximate estimates, made, however, on
reliable data ensuring a high degree of probability.
<< prev. page << föreg. sida << >> nästa sida >> next page >>