
Full resolution (JPEG) - On this page / på denna sida - Sidor ...

<< prev. page << föreg. sida << >> nästa sida >> next page >>
Below is the raw OCR text
from the above scanned image.
Do you see an error? Proofread the page now!
Här nedan syns maskintolkade texten från faksimilbilden ovan.
Ser du något fel? Korrekturläs sidan nu!
This page has never been proofread. / Denna sida har aldrig korrekturlästs.
61
Xo. j I) ’r "’ h ’ Th. j cs j ts ’’F 1 tr 1 1 4
187S j " ’
374- Aug. 22 i 78 16 60 0 0 "
7.40 p.m. 1 15 33 l’"- O 4-7 ° 0 4-7 4-7
110 j 60 ! 91 0.9 -0.16 0-74 0.74 0.7
375- Aug. 23 75 30 204
12.0 p.m. ’S 3 G- 1 0 1 4-8 4.8 i 4.8
18 1 10 1 9’ i 54 -0.12 ’ 5.38 5.28 ! 5.3
37 ’ 20 , .1 4-5 ,; -I-0.07 1 4-57 4-57 i 4.6
91 SO VI1 4-05 1 +0.10 4.15 -0.01 4.14 4. r
•83 100 II 3-3 j +0.13 3-33 -0.02 3-31 3-3
238 ’3° : III 2.6 I +0.24 3.84 -O.Ol 2.83 2.8
•v..
226.9 -0.83
-0.4 +0.11 -0.29
-1-0.27 2-40 2.4
-0.42
+0.31 -0.51 I
-0.041 -0.331
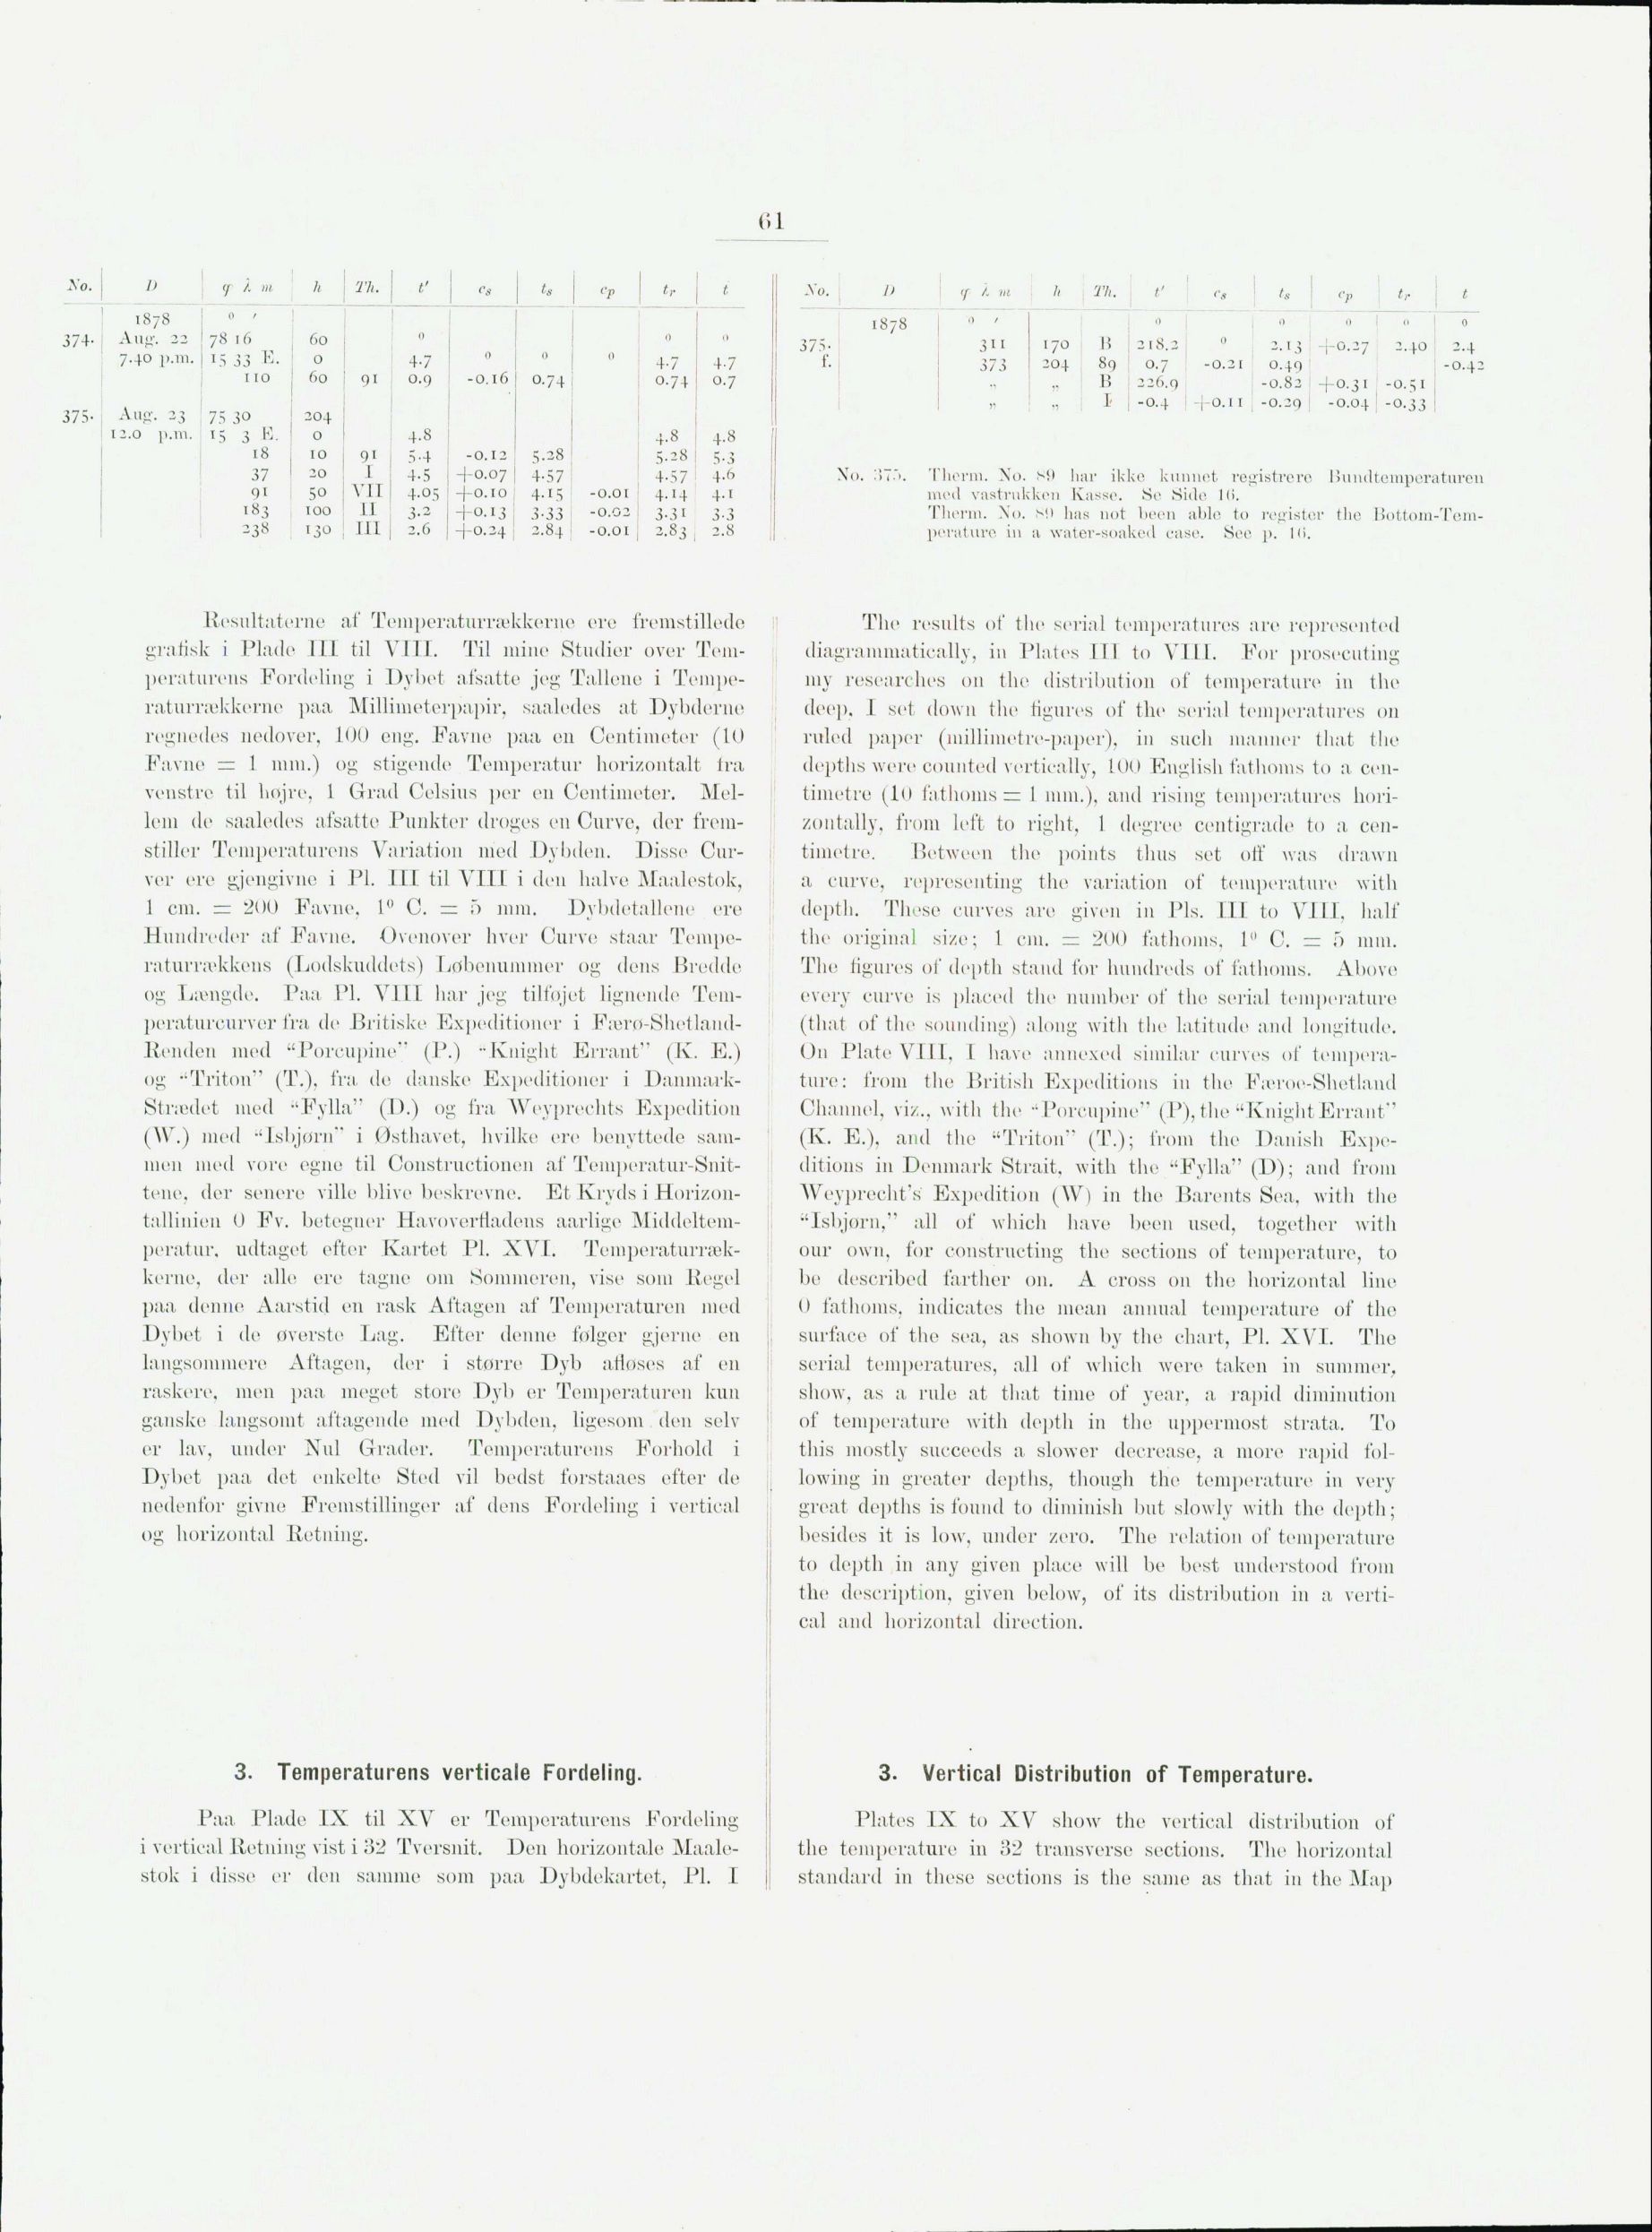
Therm. No. S SI har ikke kunnet registrere Biiiultcmperatnren
meil vastriikken Kasse. Se Sille l(i.
Therm. No. Mi lias not been able to register the
Bottom-Temperature in a water-soaked case. See p. 1<>.
Resultaterne af Temperaturrækkerne ere fremstillede
grafisk i Plade III til VIII. Til mine Studier over
Temperaturens Fordeling i Dybet afsatte jeg Tallene i
Temperaturrækkerne paa Millimeterpapir, saaledes at Dybderne
regnedes nedover, 100 eng. Favne paa en Centimeter (10
Favne rz 1 111111.) og stigende Temperatur horizontalt trå
venstre til højre, 1 Grad Celsius per en Centimeter.
Mellem de saaledes afsatte Punkter droges en Curve, der
fremstiller Temperaturens Variation med Dybden. Disse
Curver ere gjengivne i Pl. III. til VIII i den halve Maalestok,
1 cm. = 200 Favne, 1° C. = b mm. Dybdetallene ere
Hundreder af Favne. Ovenover hver Curve staar
Tempe-raturrækkens (Lodskuddets) Løbenummer og dons Bredde
og Længde. Paa PI. VIII har jeg tilføjet lignende
Tein-peratureurver fra de Britiske Expeditioner i
Færø-Shetlaud-Renden med "Porcupine" (P.) -Knight Errant" (K. E.)
og "Triton" (T.), fra de danske* Expeditioner i
Danmark-Strædet med -’Fylla" (D.) og fra Weyprechts Expedition
(W.) med "Isbjørn" i Østhavet, hvilke ere benyttede
sammen med vore egne til Constructionen af
Temperatur-Snittene, der senere ville blive beskrevne. Et Kryds i
Horizon-tallinien 0 Fv. betegner Havoverfladens aarlige
Middeltemperatur, udtaget efter Kartet Pl. XVI.
Temperaturrækkerne, der alle ere tagne 0111 Sommeren, vise som Hegel
paa denne Aarstid en rask Aftagen af Temperaturen med
Dybet i de øverste Lag. Efter denne følger gjerne en
langsommere Aftagen, der i større Dyb afløses af en
raskere, men paa meget store Dyb er Temperaturen kun
ganske langsomt aftagende med Dybden, ligesom den selv
er lav, under Nul Grader. Temperaturens Forhold i
Dybet paa det enkelte Sted vil bedst forstaaes efter de
nedenfor givne Fremstillinger af dens Fordeling i vertical
og horizontal Retning.
The results of the serial temperatures are represented
diagrammatically, in Plates III to VIII. For prosecuting
my researches 011 the distribution of temperature in the
deep, I set down the figures of the serial temperatures 011
ruled paper (millimetre-gaper), in such manner that the
depths were counted vertically, 100 English fathoms to a
centimetre (10 fathoms rz 1 111111.), and rising temperatures
horizontally, from left to right, 1 degree centigrade to a
centimetre. Between the points thus set off was drawn
a curve, representing the variation of temperature with
depth. These curves are given in Pis. Ill to VIII, half
the original size; 1 cm. 200 fathoms, 1" C. = 5 111111.
The figures of depth stand for hundreds of fathoms. Above
every curve is placed the number of the serial temperature
(that of the sounding) along with the latitude and longitude.
On Plate VIII, I have annexed similar curves ol’
temperature: from the British Expeditions in the Færoe-Shetland
Channel, viz., with the "Porcupine" (P),the "KnightErrant"
(K. E.), and the "Triton" (T.); from the Danish
Expeditions in Denmark Strait, with the "Fylla" (D); and from
Weyprecht’s Expedition (W) in the Barents Sea, with the
"Isbjorn," all of which have been used, together with
our own, for constructing the sections of temperature, to
be described farther 011. A cross 011 the horizontal line
0 fathoms, indicates the mean annual temperature of the
surface of the sea, as shown by the chart, Pl. XVI. The
serial temperatures, all of which were taken in summer,
show, as a rule at that time of year, a rapid diminution
of temperature with depth in the uppermost strata. To
this mostly succeeds a slower decrease, a more rapid
following in greater depths, though the temperature in very
great depths is found to diminish but slowly with the depth;
besides it is low, under zero. The relation ol’ temperature
to depth in any given place will be best understood from
the description, given below, of its distribution in a
vertical and horizontal direction.
3. Temperaturens verticale Fordeling.
Paa Plade IX til XV er Temperaturens Fordeling
i vertical Retning vist i 32 Tversnit. Den horizontale
Maalestok i disse er den samme som paa Dybdekartet, Pl. I
3. Vertical Distribution of Temperature.
Plates IX to XV show the vertical distribution of
j| the temperature in 32 transverse sections. The horizontal
j standard in these sections is the same as that in the Map
<< prev. page << föreg. sida << >> nästa sida >> next page >>